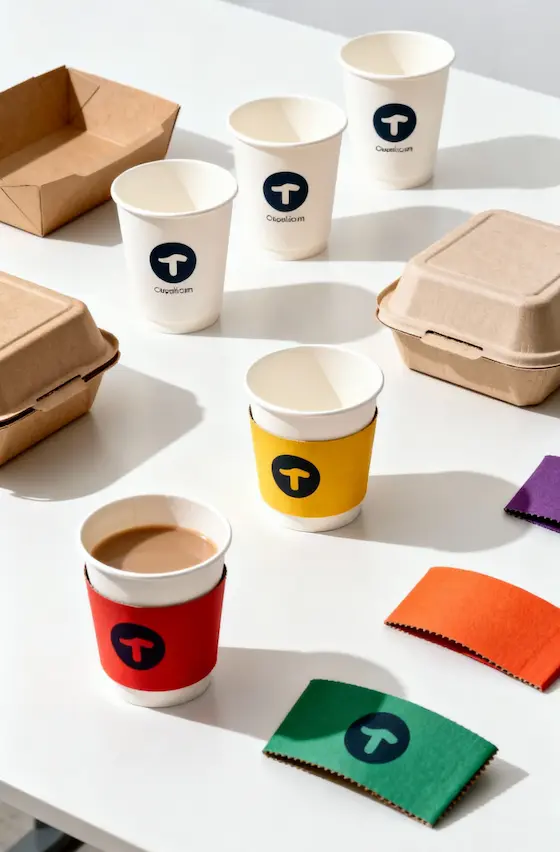
Ready to create your own branded paper cups or packaging?
Tell us your requirements — size, coating, printing, and destination — and our team will prepare a detailed quotation within 24 hours.
Last Updated: November 2025
Reading Time: 8-10 minutes
Author: Papacko Content Team
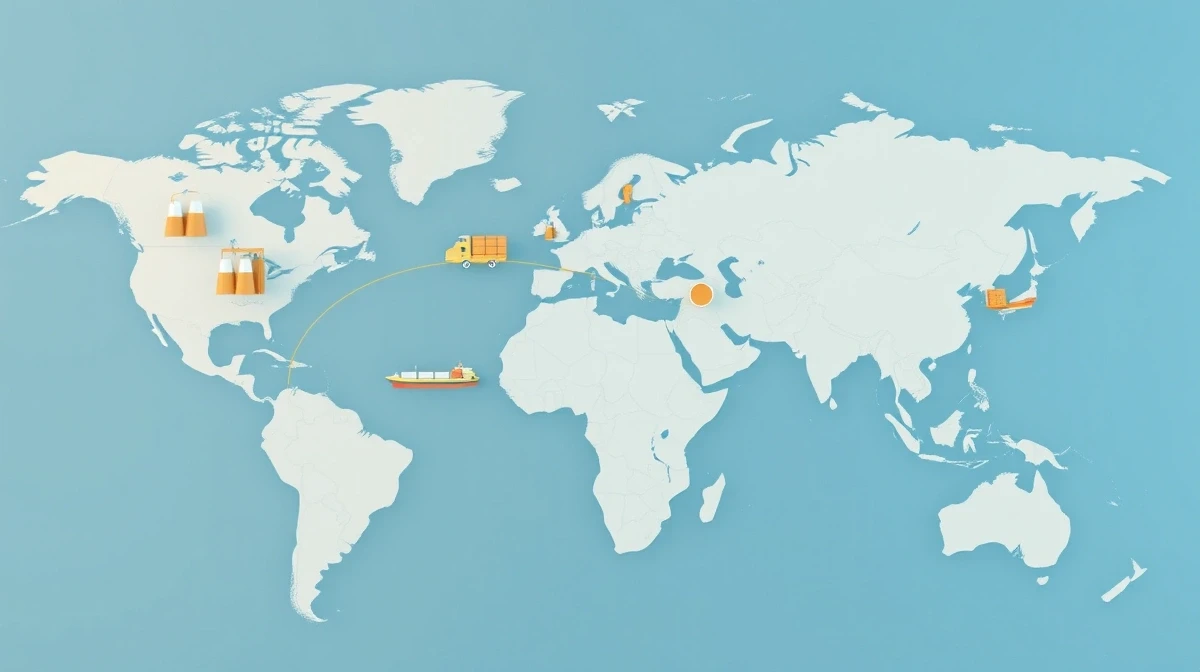
The global paper cups wholesale market moved $18.2 billion in 2024, with 420 billion units manufactured and distributed across foodservice, retail, and institutional channels. Behind every café’s morning rush and every hospital’s patient care stands a complex supply chain balancing raw material procurement, manufacturing capacity, containerized shipping, and just-in-time delivery. Understanding these dynamics separates profitable procurement from costly disruptions.
This guide examines the paper cups wholesale ecosystem from manufacturer to end-buyer, analyzing pricing structures, supply chain risks, and strategic sourcing practices for distributors, large foodservice operators, and export/import businesses.
In this article, you’ll learn:
•Global market structure and major manufacturing hubs (China, India, Turkey)
•Pricing dynamics from raw materials to landed costs
•Supply chain vulnerabilities and risk mitigation strategies
•Export/import logistics including MOQs, lead times, and documentation
💡 Quick Takeaway: Paper cup wholesale prices vary 300-500% globally based on raw material access, labor costs, and logistics.
A 12oz PE-coated cup costs $0.025-0.035 FOB China vs.
$0.08-0.12 landed in North America.
Strategic buyers source direct from manufacturers with 60-90 day lead times, while urgent orders through distributors pay 40-80% premiums.
The paper cups wholesale market comprises B2B transactions between manufacturers, distributors, importers, and large-scale end-users purchasing cups in quantities exceeding 10,000 units per order. Key market segments include:
Buyer Categories:
Product Categories:
•Single-wall cups (4-24 oz): 68% of volume
•Double-wall/ripple cups: 18% of volume
•Specialty (custom print, premium materials): 14% of volume
🎯 Industry Insight: 72% of paper cup wholesale volume flows through distributors who aggregate orders from small-to-medium buyers.
Only 28% is direct manufacturer-to-end-user, typically large chains with centralized procurement (Starbucks, McDonald’s, Sodexo).
China (45% of global capacity):
•Production Volume: ~190 billion cups annually
•Cost Advantage: $0.020-0.030 FOB for standard 12oz PE-coated cups
•Key Regions: Zhejiang (Wenzhou, Taizhou), Guangdong (Dongguan, Shenzhen), Jiangsu
•Strengths: Massive scale, integrated supply chain (paper mills, coating, printing)
•Weaknesses: Quality variation, IP protection concerns, 20-35 day shipping to US/EU
India (12% of global capacity):
•Production Volume: ~50 billion cups annually
•Cost: $0.025-0.035 FOB (slightly higher labor + energy costs)
•Export Focus: Middle East, Africa, Southeast Asia (geographic advantage)
•Strengths: English language, growing capacity investment
•Weaknesses: Infrastructure bottlenecks, inconsistent power supply
Turkey (8% of global capacity):
•Production Volume: ~34 billion cups annually
•Cost: $0.035-0.045 FOB
•Geographic Advantage: 7-12 day shipping to EU, access to Middle East/North Africa
•Strengths: Quality consistency, EU regulatory alignment
•Weaknesses: Limited scale vs. Asian competitors
North America Domestic (15% of global capacity):
•Production Volume: ~63 billion cups (primarily for domestic consumption)
•Cost: $0.06-0.09 ex-factory (2-3× China FOB)
•Players: Dart Container, Huhtamaki, Georgia-Pacific, Solo Cup
•Strengths: Zero import delays, guaranteed quality/certifications
•Weaknesses: High labor/energy costs, limited price competition
EU Domestic (10% of global capacity):
•Production Volume: ~42 billion cups
•Cost: $0.07-0.11 ex-factory
•Regulation: Stringent food contact and environmental compliance
•Trend: Consolidation (major players acquiring smaller mills)
Capacity Utilization (2024):
Cost Components (Standard 12oz PE-Coated Cup):
Raw Material Price Trends (2020-2025):
Implication: Paper cup wholesale prices closely track pulp and PE markets with 2-3 month lag. Buyers benefit from locking prices during pulp troughs (typically Q3-Q4).
China Export Example (12oz Cup, PE-Coated, MOQ 500,000 pcs):
Distributor Markup Structure:
•Distributor Cost: $0.03425 landed
•Warehouse/Handling: +$0.008 per unit
•Distributor Margin: 25-35% → +$0.011-0.015
•Wholesale Price to Buyer: $0.053-0.057 per unit
•End-Retail Markup (if resold): +30-50% → $0.069-0.086 per unit
Key Finding: Importers buying 500,000+ units direct from manufacturers save 35-50% vs. purchasing from domestic distributors, but must manage 60-90 day lead times and quality assurance.
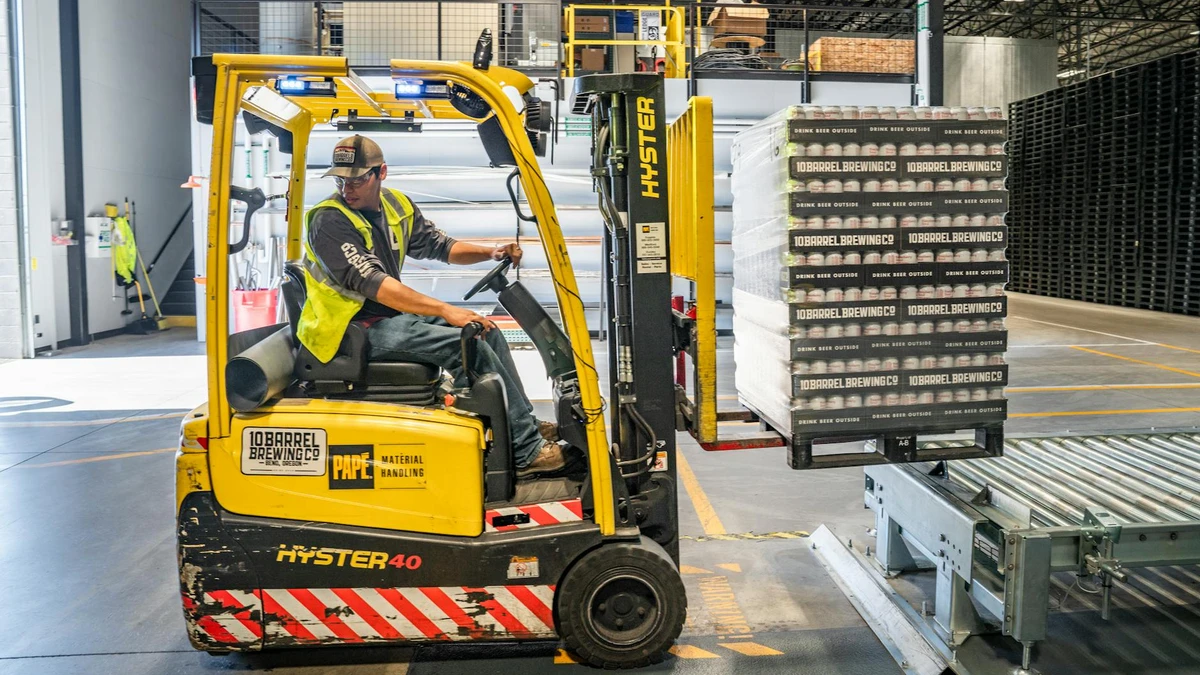
20-Foot Container Capacity:
40-Foot High-Cube Container:
•Capacity: 2.2-2.5× a 20′ container
•Cost: 1.6-1.8× the freight cost of 20′
•Unit Economics: 20-30% better per-cup freight cost
Ocean Freight Cost Drivers (2024-2025):
Freight Market Volatility:
•2020-2021 (COVID): Freight costs spiked 300-500%
•2023-2024: Normalization to +60-80% above pre-COVID baseline
•Hedging Strategy: Large buyers negotiate annual contracts with carriers for volume commitments
Stock/Generic Cups (White/Kraft, No Print):
•MOQ: 10,000-50,000 units
•Lead Time: 7-15 days (ex-stock in warehouse)
•Price: Highest per-unit (but lowest total investment)
•Use Case: Urgent orders, small operators, trial purchases
Stock + Logo Sticker:
•MOQ: 20,000-100,000 units
•Lead Time: 15-25 days (stock cup production + sticker application)
•Price: +10-15% vs. full custom print
•Use Case: Branding on budget, franchise consistency without full custom
Custom 1-Color Print:
•MOQ: 50,000-100,000 units
•Lead Time: 25-35 days (plate making + production)
•Setup Cost: $300-800 (plate/die making)
•Use Case: Coffee shops, small chains, straightforward branding
Custom Full-Color Print (CMYK):
•MOQ: 100,000-300,000 units
•Lead Time: 35-50 days (design approval, color matching, production)
•Setup Cost: $800-2,000
•Price: +20-35% vs. stock, but superior brand impact
•Use Case: Major chains, premium brands, high-visibility retail
Fully Custom (Unique Size/Shape/Material):
•MOQ: 300,000-1,000,000 units (die tooling amortization)
•Lead Time: 60-90 days
•Setup Cost: $3,000-10,000 (custom molds, testing)
•Use Case: Starbucks Reserve, limited editions, innovation projects
Manufacturer Scheduling Realities:
•High Season (Q3-Q4, holidays): 6-8 week lead times even for stock orders
•Low Season (Q1-Q2): Negotiate 10-20% discounts for off-peak production
•Rush Orders: 200-300% premium for expedited production (if capacity allows)
Inventory Holding Costs:
Recommendation: Order 2-3 months supply for fast-moving stock items, 1-2 months for custom/seasonal designs to balance costs and flexibility.
Critical Quality Checkpoints:
Third-Party Inspection Services:
•SGS, Intertek, TÜV: $500-1,200 per inspection (300-500 unit sample)
•When to Use: First order from new supplier, production >200,000 units
•ROI: Prevents $10,000-50,000 losses from defective shipments
Essential Certifications:
Red Flags in Supplier Vetting:
❌ Refuses factory audit: Likely hiding capacity or quality issues
❌ No certifications: Regulatory risk, may fail customs
❌ Price 30%+ below market: Corners cut somewhere (material, labor, safety)
❌ Unwilling to provide samples: Quality concerns
❌ No export experience: Documentation errors, shipment delays
Manufacturer/Exporter Provides:
Buyer/Importer Provides:
•Import License (if required in destination country)
•Tax ID / Import Registration
•Letter of Credit (if payment term is L/C)
United States:
•HS Code: 4823.69 (Other articles of paper pulp, paper, etc.)
•Tariff Rate: 0-5.5% (depends on material, coating)
•Trade Agreements: USMCA (0% from Canada/Mexico), GSP (varies)
European Union:
•HS Code: 4823.69
•Tariff Rate: 0-6.5%
•Non-Tariff Barriers: REACH compliance (chemical safety), food contact regulation
United Kingdom (Post-Brexit):
•HS Code: 4823.69
•Tariff Rate: 0-6.5% (aligned with EU for now)
•Unique Requirement: UKCA marking for food contact materials
Middle East (UAE, Saudi Arabia):
•Tariff Rate: 5-10%
•Halal Certification: Not required for paper cups but some buyers request
•SASO/ESMA Standards: Product safety certifications
Duty Savings Strategies:
•Free Trade Zones: Import to FTZ, pay duty only when releasing to market (defers cash flow)
•Bonded Warehouses: Store imported goods without paying duty until sold
•Tariff Engineering: Adjust product specs to qualify for lower HS code classification
Foodservice Recovery (Post-Pandemic):
•2024: Foodservice traffic at 102% of 2019 levels (full recovery + growth)
•2025-2030 CAGR: 4.2% growth in foodservice paper cup demand
•Driver: QSR expansion, coffee culture in emerging markets
Sustainability Mandates:
•Single-Use Plastic Bans: 72 countries with active bans by 2025 → paper cup substitution
•Corporate ESG: Major chains (McDonald’s, Starbucks) committing to 100% sustainable packaging by 2025-2030
•Consumer Preference: 68% willing to pay 5-10% more for sustainable options
E-Commerce and Delivery:
•Meal Delivery Growth: 12% CAGR (2024-2028) → increased takeaway cup usage
•Ghost Kitchens: 2,500+ operational in US alone → bulk cup purchasing
Capacity Expansion:
•India: $2.1 billion investment in paper packaging capacity (2024-2027)
•Southeast Asia: Vietnam, Indonesia ramping up production (labor cost advantage)
•Nearshoring: Mexico adding 3 major plants to serve US market (reduce shipping time/cost)
Material Innovation:
•Water-Based Coatings: 18% adoption in 2024 → projected 45% by 2028 (recyclability)
•PLA Coatings: 12% in 2024 → 22% by 2028 (compostability demand)
•Barrier Technology: Mineral coatings (non-plastic) emerging (currently 3% adoption)
Pricing Outlook (2025-2030):
## Strategic Sourcing Recommendations
Small Chains (50,000-200,000 cups/month):
•Strategy: Purchase from domestic distributors for first 1-2 years (minimize complexity)
•Transition: Once volume exceeds 200,000/month, test direct import (1-2 containers)
•Supplier Count: Maintain 2 suppliers (primary + backup) to mitigate risk
Medium Chains (500,000-2,000,000 cups/month):
•Strategy: Direct import from 1-2 Asian manufacturers (China/India), domestic backup
•Contract: Annual volume commitments for 5-10% price reductions
•Quality: Hire third-party inspection (SGS) for every shipment
Large Enterprises (5,000,000+ cups/month):
•Strategy: Multi-source (Asia primary, domestic secondary, nearshore emerging)
•Manufacturing Partnerships: Co-invest in dedicated production lines for custom specs
•Logistics: Contract directly with shipping lines (avoid freight forwarder markups)
•Hedging: Financial instruments to lock raw material costs (pulp futures)
Leverage Points:
1.Volume Commitments: Guarantee 12-month forecast for 8-12% discount
2.Payment Terms: Prepayment (50% deposit) unlocks 3-5% pricing concession
3.Flexibility: Accept longer lead times (90 days vs. 60) for 5-8% savings
4.Off-Peak Production: Order in Q1-Q2 (low season) for 10-15% discounts
Red Lines (Don’t Compromise):
•Quality Certifications: Always require FDA/EU compliance (non-negotiable)
•Inspection Rights: Reserve right to factory audit before large orders
•Force Majeure: Cap liability for supply chain disruptions but ensure backup supply
❌ Mistake #1: Choosing supplier solely on lowest price without factory audit
✅ Correct Approach: Visit factory or hire third-party inspector for orders >$50,000. Verify equipment age, raw material sources, quality controls
❌ Mistake #2: Ordering exactly what you need with zero buffer
✅ Correct Approach: Add 3-5% safety stock to order. Shipping delays, quality rejects, and demand spikes will occur—buffer prevents stock-outs
❌ Mistake #3: Paying by wire transfer before production/inspection
✅ Correct Approach: Use Letter of Credit or escrow services for first 2-3 orders. Release 70% on inspection, 30% on delivery
❌ Mistake #4: Ignoring tariff classification optimization
✅ Correct Approach: Work with customs broker to verify HS code. Small specification changes can shift from 5.5% to 0% tariff
The paper cups wholesale market comprises B2B transactions where buyers purchase 10,000+ units per order from manufacturers or distributors. It moved $18.2 billion globally in 2024 (420 billion units) across foodservice, institutional, and retail channels.
MOQs vary by customization: 10,000-50,000 for stock cups, 50,000-100,000 for 1-color print, 100,000-300,000 for full CMYK print, and 300,000-1,000,000 for custom sizes/shapes. Container load economics favor 500,000+ unit orders for import.
Standard 12oz PE-coated cups: $0.020-0.030 FOB China, $0.035-0.045 FOB Turkey, $0.06-0.09 ex-factory North America, $0.053-0.057 from US distributors (landed + markup). Compostable PLA-coated adds 20-35% premium.
Stock/generic: 7-15 days, custom print: 25-50 days, ocean freight adds 14-38 days (China→US), full cycle from PO to delivery: 45-90 days for imports, 15-30 days for domestic. Peak season (Q3-Q4) adds 2-4 weeks.
China produces 45% of global capacity (~190 billion cups/year), India 12%, Turkey 8%, North America 15%, EU 10%. China offers lowest FOB costs ($0.020-0.030) but longest shipping. Turkey provides EU proximity advantage.
FDA Food Contact Notification (US market), EU Regulation 10/2011 compliance (Europe), FSC/PEFC (sustainable forestry), ISO 9001 (quality management). Third-party testing (SGS, Intertek) recommended for first orders and >200,000 unit shipments.
Direct manufacturer sourcing (save 35-50% vs. distributors), container-load orders (500,000+ units), annual volume commitments (8-12% discount), off-peak production (Q1-Q2, 10-15% discount), multi-sourcing competition, payment term optimization (prepayment unlocks 3-5%).
The paper cups wholesale market operates as a complex global ecosystem where raw material volatility, manufacturing capacity, shipping logistics, and regulatory compliance intersect to determine pricing and availability. Successful buyers navigate this landscape not through one-time transactional purchases but through strategic supplier relationships, supply chain diversification, and proactive quality management.
Key Takeaways:
1.Geographic cost arbitrage is significant: FOB China ($0.020-0.030) vs. North America domestic ($0.06-0.09) creates 35-50% savings for importers willing to manage 60-90 day lead times
2.Container-load economics matter: 500,000+ unit orders optimize freight costs (40%+ per-unit savings vs. LCL/air freight)
3.Quality assurance is non-negotiable: Third-party inspection ($500-1,200) prevents $10,000-50,000 losses from defective shipments
4.Multi-sourcing mitigates risk: Primary Asian supplier + domestic backup balances cost and supply security
5.Sustainability drives future pricing: Water-based/PLA coatings command 20-35% premiums now but will become baseline as regulations tighten (2025-2030)
Whether you’re a distributor consolidating supply, a QSR chain optimizing procurement, or an importer building a paper products portfolio, understanding these supply chain dynamics enables you to negotiate better terms, manage risks proactively, and capitalize on market inefficiencies that separate profitable operations from margin erosion.
•Export and Wholesale Services
Papacko manufactures and exports paper cups to 45+ countries with production capacity of 12 billion units annually. We offer MOQs from 50,000 units, FDA/EU certified materials, and full container-load direct shipping. Our supply chain includes 60-day production planning, SGS pre-shipment inspection, and export documentation handling.
Wholesale sourcing decisions usually depend on demand signals, chain-level buying requirements, export paperwork, and a clear view of the production system behind the quote.
Get in touch:
Last Updated: November 2025