Ready to create your own branded paper cups or packaging?
Tell us your requirements — size, coating, printing, and destination — and our team will prepare a detailed quotation within 24 hours.
Last Updated: November 2025
Reading Time: 8-10 minutes
Author: Papacko Content Team
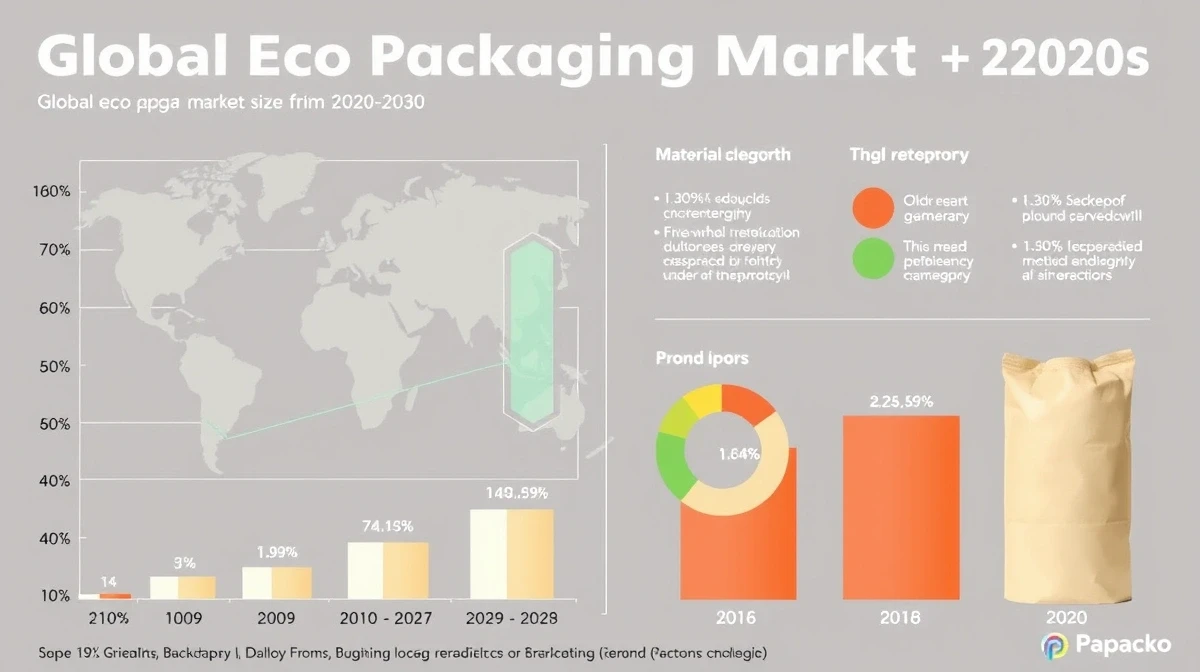
The eco packaging market is experiencing unprecedented growth. Global demand for sustainable packaging solutions reached $267 billion in 2024, and projections show it hitting $413 billion by 2030—a compound annual growth rate (CAGR) of 7.5%. But behind these numbers lie fundamental shifts in regulation, consumer behavior, and material innovation that are reshaping the entire food packaging industry.
This data-driven guide analyzes the forces driving eco packaging adoption, breaks down regional market dynamics, and provides actionable insights for businesses navigating this transformation.
In this article, you’ll discover:
•Market size and growth projections across regions and material categories
•Regulatory drivers shaping packaging requirements in EU, North America, and Asia
•Consumer behavior trends influencing purchasing decisions
•Material innovation and emerging technologies
💡 Quick Takeaway: The eco packaging market isn’t just growing—it’s accelerating.
Businesses that invest in sustainable packaging now gain competitive advantage, regulatory compliance, and access to premium consumer segments willing to pay 10-15% more for eco-friendly products.
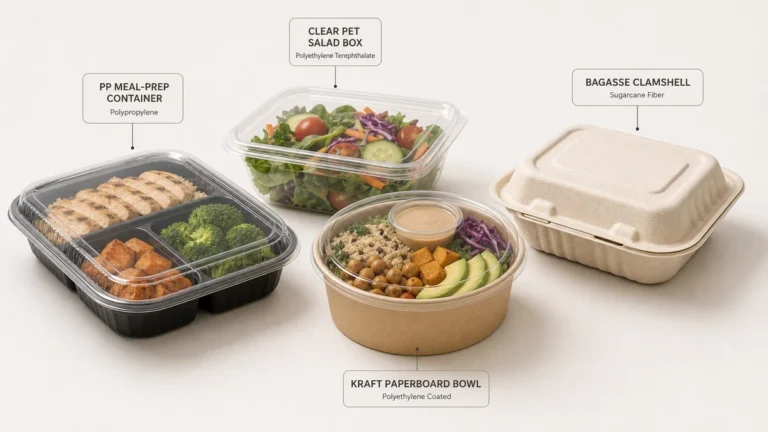
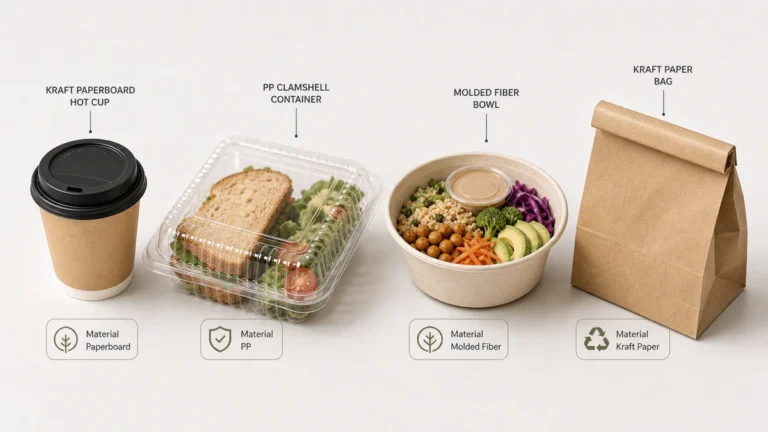
The eco packaging market encompasses all packaging materials and solutions designed to minimize environmental impact through:
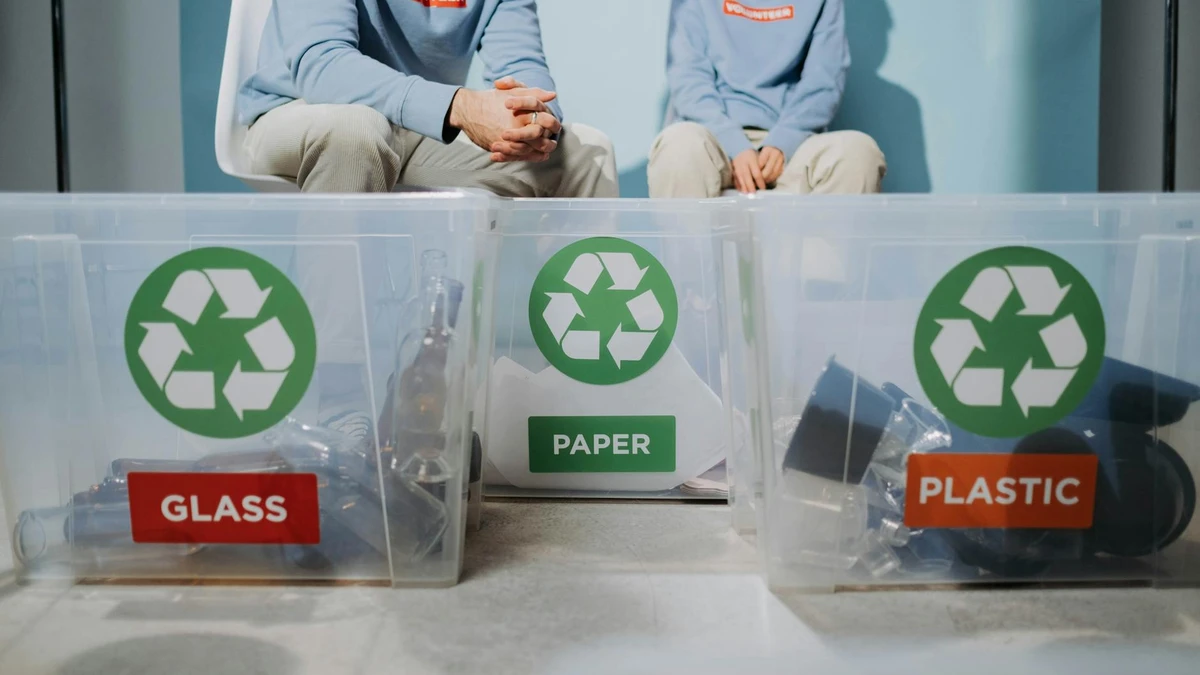
•Recyclable materials (paper, cardboard, certain plastics)
•Compostable/biodegradable options (PLA, molded fiber, bagasse)
•Reusable systems (deposit-return schemes, refillable containers)
•Reduced material use (lightweighting, minimalist design)
Market Segments:
Key Applications:
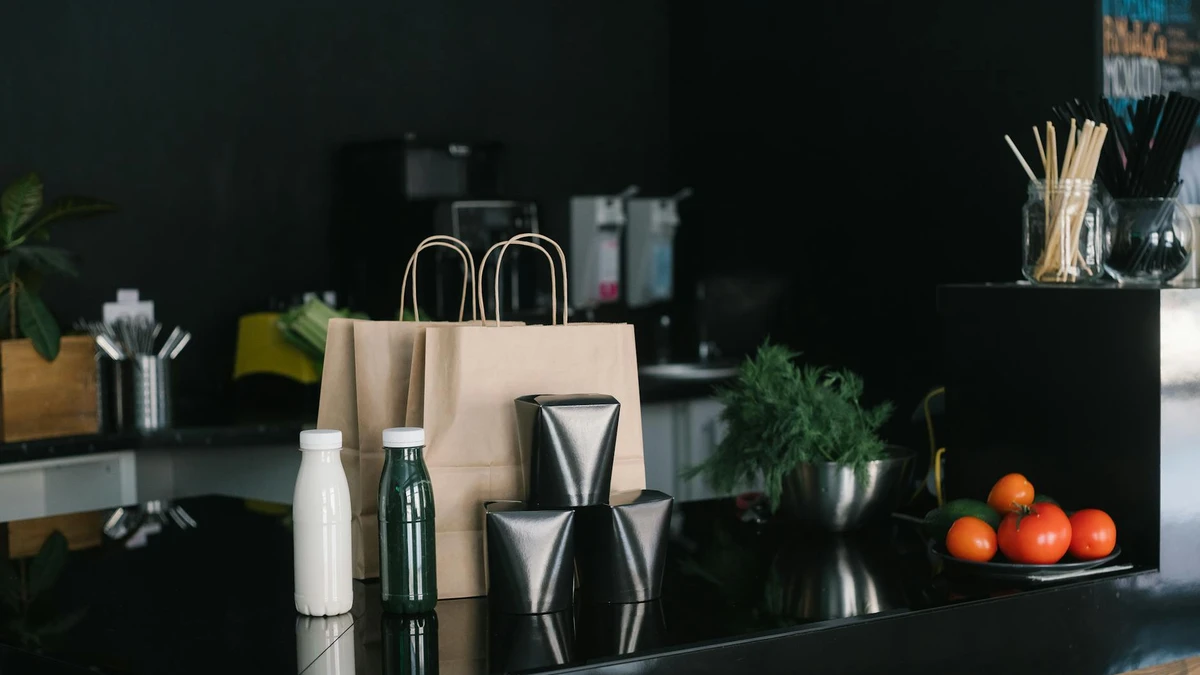
•Foodservice (cups, bowls, takeaway containers): 42% of eco packaging market
•Retail Food Packaging (fresh produce, bakery): 28%
•E-commerce Shipping: 15%
•Personal Care/Cosmetics: 10%
•Other: 5%
🎯 Industry Insight: Foodservice dominates eco packaging demand because regulatory pressure and consumer visibility are highest in this sector.
Quick-service restaurants face immediate brand risk from non-sustainable packaging.
Top Growth Markets (2024-2030):
1.India: 11.2% CAGR (driven by 2022 single-use plastic ban)
2.Indonesia: 10.8% CAGR (ASEAN sustainability commitments)
3.Germany: 9.5% CAGR (Packaging Act compliance, deposit systems)
4.United Kingdom: 9.1% CAGR (Plastic Packaging Tax)
5.United States: 7.9% CAGR (state-level divergence, California leading)
Paper-Based Packaging Growth:
•2024 Market Size: $101 billion
•2030 Projection: $148 billion
•CAGR: 6.8%
•Key Products: Paper cups, food boxes, shopping bags, molded fiber containers
Why paper leads: Established recycling infrastructure, consumer familiarity, cost competitiveness with conventional plastics in many applications.
Bioplastics Growth:
•2024 Market Size: $32 billion
•2030 Projection: $64 billion
•CAGR: 12.3%
•Key Products: PLA-coated cups, compostable cutlery, bio-based films
Challenge: Requires industrial composting facilities not yet available in many markets. Contamination of recycling streams remains a concern.
EU Single-Use Plastics Directive (2021):
•Bans plastic plates, cutlery, straws, stirrers, balloon sticks
•Mandates 90% PET bottle collection by 2029
•Requires extended producer responsibility (EPR) for all packaging
Impact on Eco Packaging Market:
UK Plastic Packaging Tax (2022):
•£200/tonne tax on plastic packaging with <30% recycled content
•Drives shift to paper-based alternatives or higher recycled plastic content
•Result: 24% increase in demand for recycled kraft food containers
United States (State-by-State Variation):
Canada:
•Federal single-use plastics ban (2022-2025 phased rollout)
•Affects checkout bags, cutlery, straws, stir sticks, takeaway containers
•Market impact: 19% annual growth in compostable foodservice packaging
China:
•2020: Ban on non-degradable plastic bags in major cities
•2022: Extended to all cities and counties
•2025 Target: 40% reduction in single-use plastic consumption
•Market Impact: $12 billion investment in paper and bio-based packaging capacity
Japan:
•Plastic Resource Circulation Act (2022)
•Mandatory charges for plastic bags and cutlery
•Target: 60% recycling rate for plastic packaging by 2030
•Result: 17% increase in paper-based takeaway packaging
India:
•2022 ban on identified single-use plastic items
•Thickness requirements for allowed plastic bags
•Market Response: Surge in demand for banana leaf, bagasse, and paper alternatives (+35% growth 2022-2024)
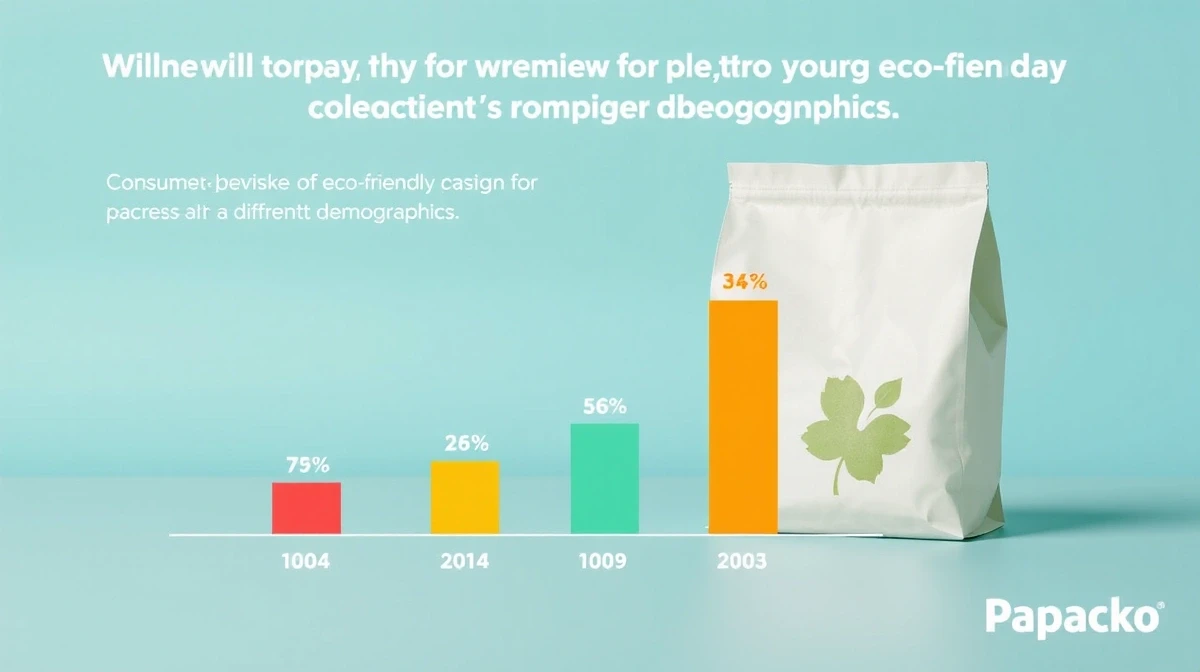
Question: “Would you choose a product with eco-friendly packaging over conventional packaging if the price was the same?”
Premium Willingness:
Key Insight: The “sweet spot” is 5-10% premium. Beyond 15%, only eco-conscious early adopters remain willing to pay.
Foodservice:
•78% of consumers expect cafés and restaurants to use compostable or recyclable packaging
•62% would actively avoid businesses using polystyrene foam containers
•54% photograph and share aesthetically pleasing sustainable packaging on social media
E-Commerce:
•71% prefer minimal packaging with recycled materials
•49% would choose one retailer over another based on sustainable packaging
•38% have stopped purchasing from a brand due to excessive packaging waste
Paper Innovation Focus Areas:
1.Barrier Coatings: Water-based and mineral coatings replacing PLA/PE for improved recyclability
2.Molded Fiber: 3D forming for complex shapes (bowls, clamshells) with minimal material
3.Nanocellulose: Ultra-thin, strong films with oxygen/moisture barrier properties
Major Corporate Investments (2023-2024):
•Nestlé: $2.1 billion commitment to sustainable packaging R&D by 2025
•Unilever: Transitioning to 100% reusable, recyclable, or compostable packaging by 2025
•McDonald’s: $1.4 billion invested in fiber-based packaging infrastructure
•Starbucks: Eliminating plastic straws globally (1 billion straws/year replaced)
M&A Activity:
•Paper packaging companies acquired 37 bio-based material startups (2023)
•Average acquisition premium: 42% above market valuation
•Focus areas: PLA coating alternatives, molded fiber technology, recycled content sourcing
Composting Facility Availability:
Problem: PLA-coated cups and compostable containers require industrial composting (55-60°C for 12+ weeks). Without infrastructure, they contaminate recycling streams or end up in landfills where they don’t biodegrade.
Price Comparison (per unit, bulk pricing):
Break-Even Analysis:
•High-volume operations (>50,000 units/month): Premium narrows to 20-40% with direct manufacturer sourcing
•Small businesses (<5,000 units/month): Face 80-150% premium due to MOQ constraints and distribution markups
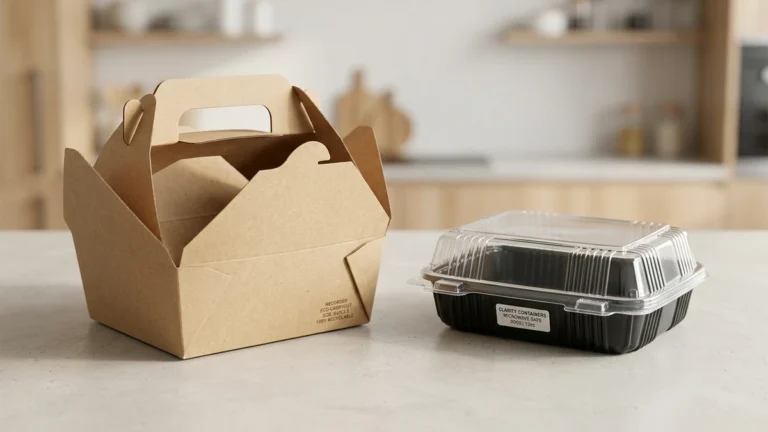
Common Misunderstandings:
1.“Biodegradable = Environmentally Safe”: Not true if items end up in landfills without oxygen/microbes
2.“All Paper Packaging is Recyclable”: False—coated papers often contaminate recycling streams
3.“Compostable Means Home Compostable”: Most require industrial facilities at specific temperatures
Industry Response: Clearer labeling standards, certification marks (BPI, TÜV Austria, Seedling logo), consumer education campaigns.
Assess Your Market Position:
### ROI Beyond Cost
Tangible Benefits:
•Regulatory Compliance: Avoid fines ($5,000-$50,000/violation in some jurisdictions)
•Market Access: Required for contracts with major retailers/chains
•Waste Management: Potential savings on disposal costs in pay-per-weight systems
Intangible Benefits:
•Brand Equity: 37% of millennials willing to switch brands for sustainable packaging
•Social Media: 54% higher engagement on posts featuring eco-packaging
•Employee Morale: 68% of workers prefer employers with sustainability commitments
❌ Mistake #1: Assuming “eco-friendly” claims don’t require substantiation
✅ Correct Approach: Obtain third-party certifications (FSC, BPI, TÜV) and clearly communicate limitations (e.g., “industrially compostable”)
❌ Mistake #2: Switching to bioplastics without verifying local composting infrastructure
✅ Correct Approach: Audit your region’s waste management capabilities and choose materials that align with available end-of-life systems
❌ Mistake #3: Underestimating supply chain lead times for eco packaging
✅ Correct Approach: Plan 8-12 weeks for custom paper/bio-based packaging vs. 2-4 weeks for conventional plastic
❌ Mistake #4: Ignoring total lifecycle environmental impact
✅ Correct Approach: Conduct LCA (lifecycle assessment) to verify that eco-alternative actually reduces net impact (some require more energy/water in production)
The eco packaging market encompasses all packaging materials designed to minimize environmental impact through recyclability, compostability, reusability, or reduced material use. It reached $267 billion globally in 2024 and is projected to grow to $413 billion by 2030.
The global eco packaging market is growing at a 7.5% compound annual growth rate (CAGR) from 2024-2030. Bioplastics segment grows faster (12.3% CAGR) while conventional plastics decline (-2.1% CAGR).
Key drivers include: (1) Regulatory mandates (EU Single-Use Plastics Directive, state-level bans in US/Canada), (2) Consumer demand (68% prefer sustainable packaging at comparable prices), and (3) Corporate ESG commitments from major brands.
Yes. Eco packaging typically costs 30-150% more than conventional plastic equivalents, depending on material and volume. High-volume buyers (>50,000 units/month) can narrow this to 20-40% premium through direct manufacturer relationships.
Europe leads with $98 billion market size and 8.2% CAGR, driven by comprehensive EU regulations. Asia-Pacific shows strong growth (7.9% CAGR) led by China’s plastic waste policies and India’s single-use bans.
Main challenges: (1) Insufficient composting infrastructure for bioplastics, (2) Cost premiums limiting small business adoption, (3) Consumer confusion about disposal methods, and (4) Performance gaps in moisture resistance and shelf life for some materials.
No. Eco packaging will capture an estimated 70% of foodservice packaging and 55% of retail food packaging by 2030, but conventional plastics will persist in applications requiring extreme durability, barrier properties, or cost optimization.
The eco packaging market’s growth trajectory reflects a fundamental restructuring of the global packaging industry. Regulatory momentum, consumer preferences, and corporate sustainability commitments have aligned to create irreversible momentum toward sustainable alternatives.
Key Takeaways:
1.Market size will increase 55% from 2024 ($267B) to 2030 ($413B), with bioplastics growing fastest (12.3% CAGR)
2.Regulatory pressure drives adoption more than consumer willingness to pay, particularly in EU and progressive US states
3.Paper-based packaging dominates current transitions due to established recycling infrastructure and cost competitiveness
4.Infrastructure gaps limit bioplastics: Only 18-32% of populations have access to industrial composting needed for PLA materials
5.Price premiums are narrowing: Bulk buyers now pay 20-40% more vs. 80-150% for small purchasers
Businesses that proactively transition to eco packaging gain regulatory compliance, brand equity, and access to growing consumer segments. Those that delay face increasing costs from regulations, market access restrictions, and brand reputation risks.
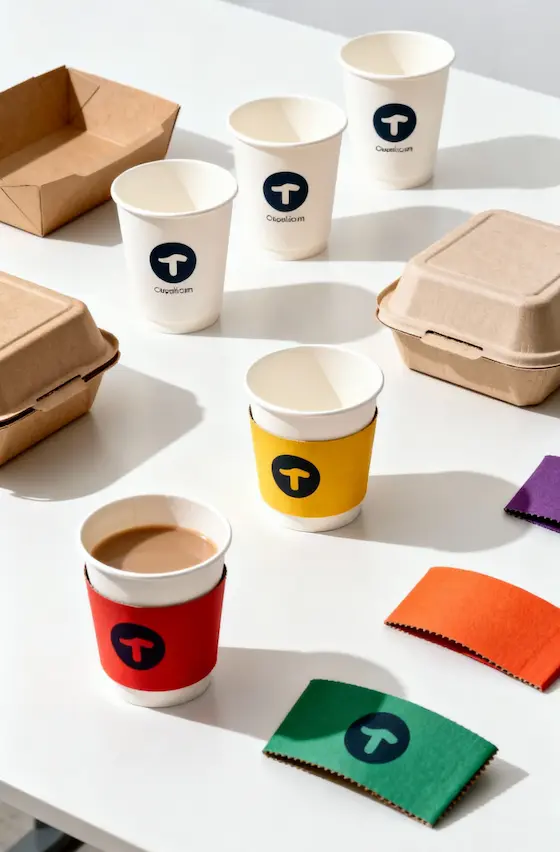
Papacko manufactures a complete range of sustainable food packaging solutions including paper cups, molded fiber containers, and compostable accessories. Our products meet EU and North American regulatory standards and are certified for recyclability or industrial composting.
Market-growth pages are most useful when they connect numbers to operational choices: certification, legal pressure, and which sustainability routes are commercially actionable right now. These pages help bridge trend data with execution.
Get in touch:
Last Updated: November 2025