¿Está listo para crear sus propios vasos o envases de papel con su marca?
Díganos sus requisitos -tamaño, revestimiento, impresión y destino- y nuestro equipo le preparará un presupuesto detallado en 24 horas.

The global “>paper cups market stands at a critical inflection point entering 2027, with industry valuations projected to reach $14.8 billion—representing 8.2% year-over-year growth from 2026’s $13.7 billion. This expansion is driven by converging forces: accelerating single-use plastic bans across 87 countries, rapid foodservice recovery post-pandemic reaching 112% of 2019 levels, and material science breakthroughs enabling fully biodegradable barrier coatings that match petroleum-based performance.
This comprehensive market forecast analyzes 2027 projections across six key dimensions: regional market dynamics with Asia-Pacific commanding 42% global share, segment performance where hot beverage cups maintain 58% category dominance, material innovation trends with PLA-coated cups growing at 22% CAGR, sustainability regulations reshaping procurement standards, competitive landscape shifts as consolidation accelerates, and pricing trajectories influenced by pulp cost volatility and carbon taxation policies.
💡 Comida rápida para llevar: The 2027 paper cups market will grow 8.2% to $14.8B driven by plastic ban enforcement in 87 countries, foodservice expansion in emerging markets (+12% in India/Southeast Asia), and bio-coating adoption reaching 28% of production.
Key trends include premiumization (“>double-wall cups +15% growth), direct-to-consumer channels (+34% e-commerce), and supply chain regionalization reducing import dependency by 18-25% across major markets.
Understanding paper cups market forecast requires attention to these factors:
2027 Market Valuation:-Global market size: $14.8 billion (up from $13.7B in 2026)
-Total unit consumption: 264 billion cups (up from 248B in 2026)
-Crecimiento interanual: 8.2% (accelerating from 7.4% in 2025-2026)
-Five-year CAGR (2023-2027): 7.8%
Growth acceleration factors:-Plastic ban enforcement expanding from 72 countries (2025) to 87 countries (2027)
-Foodservice transaction volumes exceeding pre-pandemic levels by 12%
-Coffee consumption growth in emerging markets: India +18%, Indonesia +14%, Vietnam +21%
-Quick-service restaurant expansion: 47,000 net new locations globally (2026-2027)
Market maturity by region:Understanding paper cups market forecast requires attention to these factors:
2027 unit consumption breakdown:-Hot beverage cups (8-20 oz): 153 billion units (58% share)
-Cold beverage cups (12-32 oz): 91 billion units (34% share)
-Specialty/sampling cups (<6 oz): 20 billion units (8% share)
Consumo per cápita (annual cups per person):-Mature markets (US/UK): Growth from premiumization (shift to 16-20 oz sizes +12%), third-wave coffee culture, workplace coffee programs replacing in-home brewing
-Emerging markets (China/India): Urbanization (450M people in cities by 2027), millennial coffee adoption (18-35 age group consumption +25%), Western QSR expansion (Starbucks, Costa Coffee adding 3,200 locations in Asia 2026-2027)

Understanding standard paper cups market forecast requires attention to these factors:
2027 market performance:-Market size: $6.2 billion (+12.4% YoY)
-Unit consumption: 112 billion cups (+14.8% YoY)
-Share of global market: 42% (up from 39% in 2025)
Country-level breakdown:-85,000 new coffee shops opened 2025-2027 (Luckin Coffee, Manner Coffee, Cotti Coffee expansion)
-Tier 2/3 city penetration: 67% of new coffee locations in cities with <5M population (vs 42% in 2023)
-Convenience store coffee: 7-Eleven, FamilyMart adding coffee bars to 12,000 locations
-Paper cup innovation: Double-wall cups with Chinese art/calligraphy growing 32% (premiumization trend)
India market dynamics:-QSR boom: Café Coffee Day, Third Wave Coffee, Blue Tokai adding 1,800 locations (2026-2027)
-Youth consumption: 18-30 age group representing 62% of coffee shop customers (vs tea consumption declining -8%)
-Urbanization impact: Tier 1 cities reaching 45% coffee penetration (vs 12% in tier 3+ cities)
-Regulatory shift: 8 states implementing SUP bans favoring paper over plastic cups
Understanding various paper cups market forecast requires attention to these factors:
2027 market performance:-Market size: 1,44 mil millones (+5.2% YoY)
-Unit consumption: 68 billion cups (+3.8% YoY)
-Share of global market: 28% (down from 31% in 2023)
United States market specifics:-Cold beverage expansion: Iced coffee consumption growing 9% annually, driving shift to larger cup sizes (20-24 oz premium cold cups +15% volume)
-Workplace coffee programs: Corporate offices installing premium coffee bars (replacing K-cup machines) driving 8-12 oz hot cup demand +7%
-Sustainability mandates: 23 states/cities with SUP plastic bans or fees (up from 18 in 2025), accelerating paper cup adoption in holdout markets
-Direct-to-consumer: Coffee subscription boxes and e-commerce retail selling branded cup bundles +34%
Canada market specifics:-Market size: $0.6B (+4.9% YoY)
-Tim Hortons transition to fiber-based lids across all locations (completed Q2 2027) driving compatible paper cup redesigns
-Provincial plastic bans in BC, PEI, Newfoundland expanding to Ontario, Quebec (2027-2028 implementation)
For different paper cups market forecast, focus on:
2027 market performance:-Market size: $3.8 billion (+6.8% YoY)
-Unit consumption: 62 billion cups (+5.4% YoY)
-Share of global market: 26%
Country-level performance:-EU Packaging Waste Regulation (PPWR): 2027 targets requiring 20% reusable cup systems in QSRs driving dual-track strategies (paper for takeaway, ceramic/reusable for dine-in)
-Responsabilidad ampliada del productor: 18 EU countries implementing EPR fees on paper cups ($0.02-0.08 per cup), cost passed to consumers driving 3-5% demand reduction in price-sensitive segments
-Compostability certification: EN13432-certified cups growing from 22% (2025) to 31% (2027) as municipalities expand industrial composting infrastructure
UK market specifics:-Latte levy debates: Proposed 25p charge on disposable cups (similar to plastic bag levy) under consultation—if implemented in 2028, projected 18-22% demand reduction
-Coffee shop competition: Pret, Costa, Greggs offering 50p discounts for reusable cups, but paper cup volumes still growing +5% (reusable adoption plateauing at 8-12% of transactions)
For various paper cups market forecast, focus on:
2027 segment performance:-Segment value: $8.6 billion (58% of total market)
-Unit consumption: 153 billion cups (+6.2% YoY)
-Average selling price: $0.056 per cup (+2.8% vs 2026)
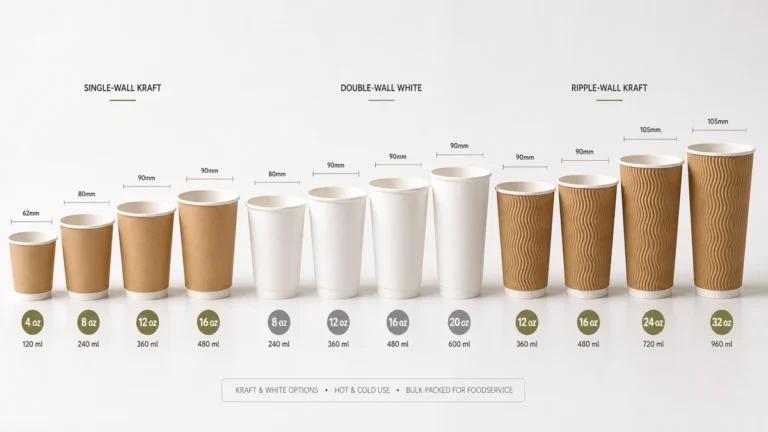
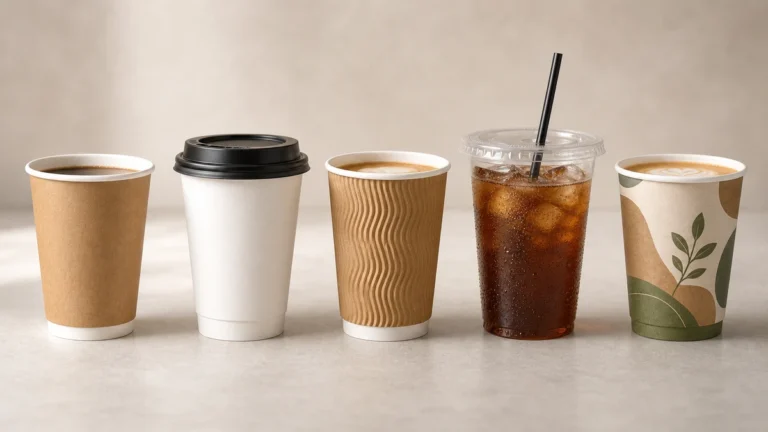
Size distribution trends:-Vasos de pared simple: 58% volume share, growing +3.2% (value segment, fast-casual dining)
-Vasos de doble pared: 34% volume share, growing +12.8% (premium segment, eliminating sleeve need)
-Vasos con pared ondulada: 8% volume share, growing +18.4% (differentiation, thermal performance, Instagram appeal)
Price segmentation:-Bio-coating adoption: PLA/aqueous coatings replacing PE lining in 28% of hot cups (up from 19% in 2025), driven by compostability certifications
-Heat tolerance improvements: New barrier technologies enabling 95°C liquid retention without warping (vs 85°C standard in legacy cups)
-Branding surface area: 40% increase in printable zones via improved coating adhesion for digital/flexo printing
The key to choosing cups market forecast depends on:
2027 segment performance:-Segment value: $5.4 billion (37% of total market)
-Unit consumption: 91 billion cups (+11.2% YoY)
-Average selling price: $0,059 por taza (+3.4% vs 2026)
Factores de crecimiento:-Iced coffee boom: Cold brew, iced lattes, frappés growing 14% annually (vs hot coffee +3%)
-Smoothie/juice bars: 8,200 new locations globally (2026-2027), primarily using 20-32 oz cold cups
-Bubble tea expansion: 14,000 new stores in Asia-Pacific, 2,400 in North America driving large-format cup demand
-Plastic straw bans: Paper straws requiring compatible paper cups (cross-material alignment)
Size distribution trends:-Resistencia a la humedad: Cold cups requiring superior barrier coatings to prevent condensation breakdown (PLA double-coating standard by 2027)
-Ice retention: Double-wall cold cups growing 42% (thermal insulation prevents sweating, eliminates need for separate sleeve/napkin)
-Compatibilidad de la tapa: Shift to fiber-based lids (vs plastic dome lids) driving cup rim redesigns for secure sealing
Regional preferences:
When evaluating standard paper cups market forecast, consider the following:
2027 coating landscape:-2027 price parity: PLA-coated cups reaching $0.048 per unit (vs $0.046 for PE-coated), making sustainable option economically viable at scale
-Performance improvements: New PLA formulations withstand 92°C liquids for 60+ minutes (vs 85°C / 30 minutes in 2023 versions)
-Infraestructura para el compostaje: 1,240 industrial composting facilities globally accepting PLA-coated cups (up from 890 in 2025), reducing “greenwashing” concerns
-Normas de certificación: 67% of PLA cups now carry third-party certifications (BPI, TÜV Austria, DIN CERTCO) vs 42% in 2024
Aqueous coating advantages:-Reciclabilidad: Compatible with standard paper recycling streams (vs PE/PLA requiring separation)
-Huella de carbono: 34% lower lifecycle emissions than PE-coated equivalents
-Regulatory favor: EU PPWR explicitly favoring recyclable over compostable packaging (driving aqueous adoption in European market)
Trayectoria de los costes:-Coating equipment upgrades: $840M invested globally (2025-2027) to retrofit production lines for aqueous/PLA application
-R&D spending: Paper cup manufacturers allocating 4-7% of revenue to barrier coating development (vs 2-3% historically)
For standard paper cups market forecast, focus on:
2027 fiber composition:-Fibra virgen: 68% (FSC/PEFC certified: 82% of virgin fiber)
-Recycled fiber: 32% (post-consumer: 18%, post-industrial: 14%)
Certification trends:-Performance limitations: Recycled fiber cups have 12-18% lower burst strength (limiting use to cold beverages or double-wall constructions)
-Competitividad en materia de costes: Recycled fiber costs $920-1,040 per metric ton (vs virgin fiber $880-960), driven by collection/sorting infrastructure costs
-Availability constraints: Only 34% of paper cups entering recycling streams due to contamination (food residue), coating incompatibility, lack of collection programs
Iniciativas de economía circular:-Cup-to-cup recycling pilots: Starbucks, Huhtamaki, WestRock partnering on closed-loop systems in Seattle, London, Singapore (processing 2.4M cups monthly)
-Programas de recogida: 140 QSR chains implementing in-store cup recycling bins (vs 68 in 2024)
-Fiber-to-fiber technology: NextGen Consortium developing enzymatic coating removal enabling 94% fiber recovery (vs 62% with current mechanical pulping)
When evaluating various paper cups market forecast, consider the following:
2027 regulatory environment:-India national SUP ban: Full enforcement in 28 states (vs 18 in 2025), driving paper cup consumption +22% year-over-year
-Proyecto de ley SB 54 de California: Phased reduction requiring 25% reduction in SUP packaging by 2027—exemption for certified compostable paper cups driving PLA adoption
-EU PPWR implementation: Mandatory 20% reusable cup systems in QSRs with 500+ daily customers, affecting 14,000 locations but exempting takeaway (paper cups benefit)
-China city-level bans: Beijing, Shanghai, Shenzhen enforcing plastic cup bans in government buildings, schools (22M cups shifted to paper monthly)
Compliance cost impact:When evaluating standard paper cups market forecast, consider the following:
2027 EPR landscape:-18 countries implementing EPR for paper cups (vs 12 in 2025)
-Total EPR fees collected: $340M globally (2027 projected)
-Fee structure: $0.02-0.08 per cup (average: $0.044)
Fee allocation and impact:-Fee pass-through: 78% of EPR costs passed to end consumers (vs absorbed by manufacturers/retailers)
-Demand elasticity: For every $0.01 increase in cup cost, consumption decreases 1.2-1.8% in price-sensitive segments (convenience stores, gas stations)
-Premium segment insulation: Specialty coffee shops experiencing only 0.3-0.6% demand reduction (customers willing to pay for sustainability)
Producer compliance strategies:-Collective schemes: 84% of manufacturers joining industry-wide EPR organizations (vs individual compliance)
-Eco-modulation: Cups with >50% recycled content or certified compostable receiving 15-30% EPR fee reductions
-Inversión en I+D: EPR revenues funding $120M in recycling technology development (2026-2027)
Understanding available paper cups market forecast requires attention to these factors:
2027 market share by manufacturer:-M&A activity: 14 acquisitions in paper cup sector (2025-2027), totaling $2.8B in transaction value
-Top-10 concentration: Combined market share increasing from 78% (2024) to 80.2% (2027)
-Regional champions: Local manufacturers in India, Southeast Asia, Latin America growing faster than multinationals (+14% vs +7%) due to supply chain proximity, lower costs
For the paper cups market forecast, focus on:
Competitive strategies by segment:-Backward integration: 6 major manufacturers acquiring pulp mills/coating suppliers (2025-2027) to secure material supply and reduce costs
-Forward integration: Huhtamaki, Graphic Packaging launching direct-to-consumer brands selling custom cups to small cafés via e-commerce (+$180M revenue 2027)
When evaluating the paper cups market forecast, consider the following:
2027 pulp pricing:-Bleached hardwood kraft pulp (BHKP): $960/metric ton (average, +4.2% vs 2026)
-Bleached softwood kraft pulp (BSWK): $1,120/metric ton (average, +3.8% vs 2026)
-Pulpa reciclada: $840/metric ton (average, +6.4% vs 2026)
Cost composition breakdown (12 oz single-wall cup):-Natural gas prices affecting drying/forming processes: +$0.0026 per cup (2026-2027)
-Electricity for automated production lines: +$0.0006 per cup
-Manufacturers in low-energy-cost regions (Middle East, parts of Asia) gaining 8-12% cost advantage
Carbon pricing influence:-EU Carbon Border Adjustment Mechanism (CBAM): Adding $0.003-0.008 per cup for imports from non-EU countries (based on embedded carbon)
-Voluntary carbon offsets: Premium brands purchasing offsets at $0.002-0.004 per cup to achieve carbon neutrality claims
The key to choosing common paper cups market forecast depends on:
Average selling prices by segment (2027):-Deflationary pressure: Improved manufacturing efficiency (automation) reducing production costs -2.4% annually
-Inflationary pressure: Labor costs (+5.4%), energy costs (+8.2%), regulatory compliance (+3-6%) driving prices upward
-Premiumization opportunity: Customers willing to pay 15-25% premium for sustainable certifications, custom branding, superior thermal performance
Volume discount structures:When evaluating available paper cups market forecast, consider the following:
2027 channel distribution:-Amazon Business: Paper cup sales +38% (2026-2027), driven by small café/restaurant procurement
-Alibaba/1688.com: China’s B2B platforms selling 2.8B cups annually to domestic buyers
-Manufacturer direct sites: Huhtamaki, Vegware, Lollicup reporting $180M combined e-commerce revenue (vs $98M in 2025)
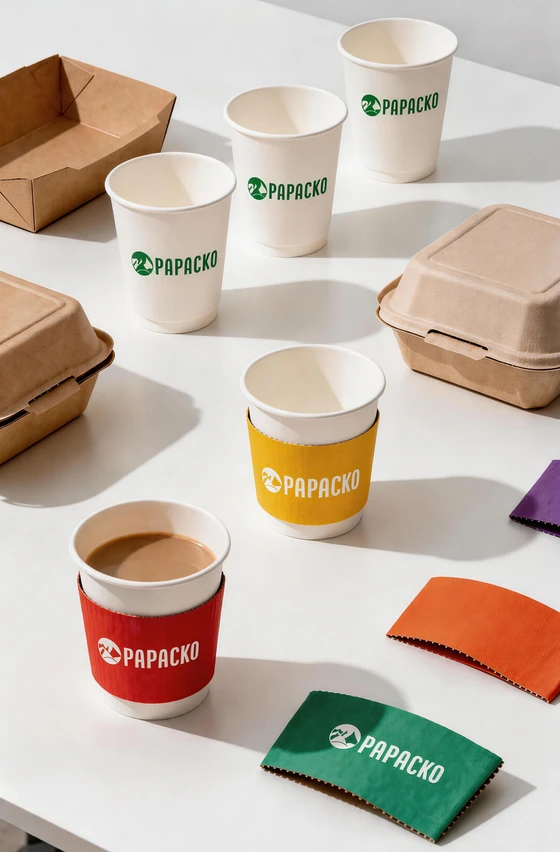
Direct-to-consumer trends:-Custom design tools: Online configurators allowing customers to design cups with logos, colors, text (MOQs as low as 500 units)
-Subscription models: Monthly cup delivery services for home coffee enthusiasts (+68% subscriber growth 2026-2027)
-Sample packs: $12-28 variety packs (50-100 cups, mixed sizes) for testing/events generating $42M sales (2027)
Digital marketing impact:-SEO/content marketing: Paper cup manufacturers investing $8-15M annually in educational content, recipe blogs, sustainability guides
-Redes sociales: Instagram/Pinterest driving visual cup designs—ripple-wall cups with aesthetic patterns growing 18% due to “Instagrammable” appeal
Understanding cups market forecast requires attention to these factors:
Procurement decision factors (ranked by importance):-Multi-unit chains: 78% using centralized purchasing (vs 64% in 2023), driving larger order volumes and manufacturer consolidation
-Group purchasing organizations (GPOs): 340 GPOs representing 42,000 independent cafés/restaurants negotiating bulk pricing (12-18% cost savings)
Inventory management shifts:-Just-in-time delivery: 34% of QSRs requesting weekly/bi-weekly deliveries (vs monthly) to reduce storage costs
-Consignment inventory: Some manufacturers offering on-site storage with pay-as-used models (eliminating upfront capital for small operators)
For cups market forecast, focus on:
2028-2030 market projections:-Asia-Pacífico: Maintaining 11-13% annual growth through 2030 (urbanization, coffee culture expansion)
-Mature markets: Stabilizing at 4-6% growth (replacement demand, premiumization, sustainability transitions)
-Regulatory acceleration: 110+ countries implementing plastic bans by 2030 (vs 87 in 2027)
-Innovación de materiales: Fully recyclable, high-barrier coatings achieving commercial scale by 2029
The key to choosing different paper cups market forecast depends on:
2027-2030 innovation priorities:-Cup-to-cup recycling: Target 25% of cups entering closed-loop systems by 2030 (vs 8% in 2027)
-Deposit-return schemes: Pilots expanding in 12 cities globally, achieving 68% return rates (vs 12% in curbside recycling)
-Blockchain traceability: QR codes on cups linking to fiber source, carbon footprint, recycling instructions
Manufacturing efficiency gains:-Velocidad de producción: Next-gen machines producing 450 cups/minute (vs 380 in 2027), reducing labor costs per unit -8%
-Material waste reduction: Improved die-cutting reducing scrap from 6.2% to 3.8%
-Eficiencia energética: LED curing, optimized drying reducing energy consumption per cup -12%
The 2027 paper cups market forecast reveals a dynamic industry at the intersection of sustainability transformation, regulatory acceleration, and emerging market growth. The $14.8 billion global market will expand 8.2% year-over-year, driven by Asia-Pacific’s explosive 12.4% growth as coffee culture penetrates China’s tier-2/3 cities and India’s organized foodservice sector matures.
Principales conclusiones:1.Divergencia regional—Asia-Pacific (42% market share) growing 2.4x faster than mature markets, with China and India representing $4.5B combined opportunity
2.Material innovation reaching inflection point—PLA-coated cups achieving near price parity ($0.048 vs $0.046 for PE), accelerating sustainable coating adoption to 34% market share by 2027
3.Premiumization driving value growth—Double-wall and ripple-wall segments growing 12-18% annually as consumers prioritize thermal performance and Instagram aesthetics over commodity cups
4.Regulatory enforcement intensifying—87 countries implementing plastic bans (vs 72 in 2025), with EPR schemes adding $0.02-0.08 per cup in 18 countries, reshaping cost structures
5.E-commerce disruption—Online B2B channels growing 34% enabling small cafés to access custom branding at lower MOQs (500-1,000 units vs 10,000+ traditional)
The paper cups market through 2030 will reward manufacturers investing in bio-coating R&D, regional production capacity in high-growth Asia markets, and direct-to-customer digital channels. Operators prioritizing sustainability certifications and supply chain transparency will command premium pricing as corporate ESG commitments and consumer environmental consciousness reshape procurement decisions.
-“>Vasos de papel
-“>Soluciones de embalaje sostenible
-“>Foodservice Packaging Trends
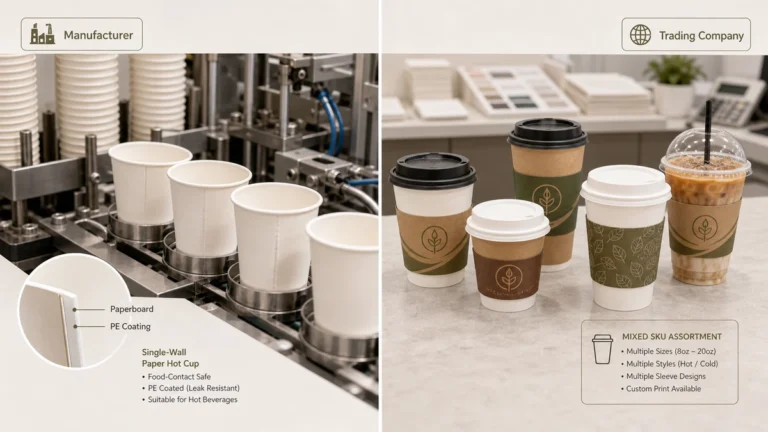
Papacko supplies foodservice operators, distributors, and retailers with paper cups aligned to 2027 market trends—offering PLA-coated compostable options, custom digital printing for emerging brands, and volume pricing for growing chains. Our market intelligence team provides quarterly forecasts and procurement strategy guidance to navigate regulatory changes, material innovations, and regional growth opportunities.
Póngase en contacto:Última actualización: abril de 2026