Prêt à créer vos propres gobelets ou emballages en papier ?
Faites-nous part de vos exigences - taille, revêtement, impression et destination - et notre équipe établira un devis détaillé dans les 24 heures.
Dernière mise à jour: novembre 2025
Temps de lecture: 8 à 10 minutes
Auteur: Équipe de contenu de Papacko
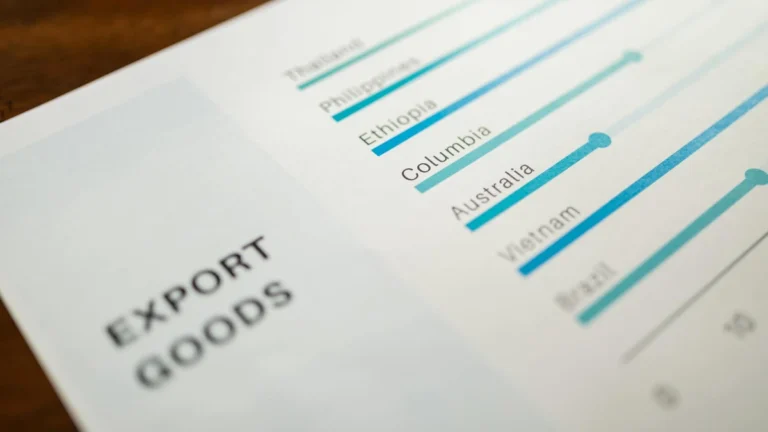
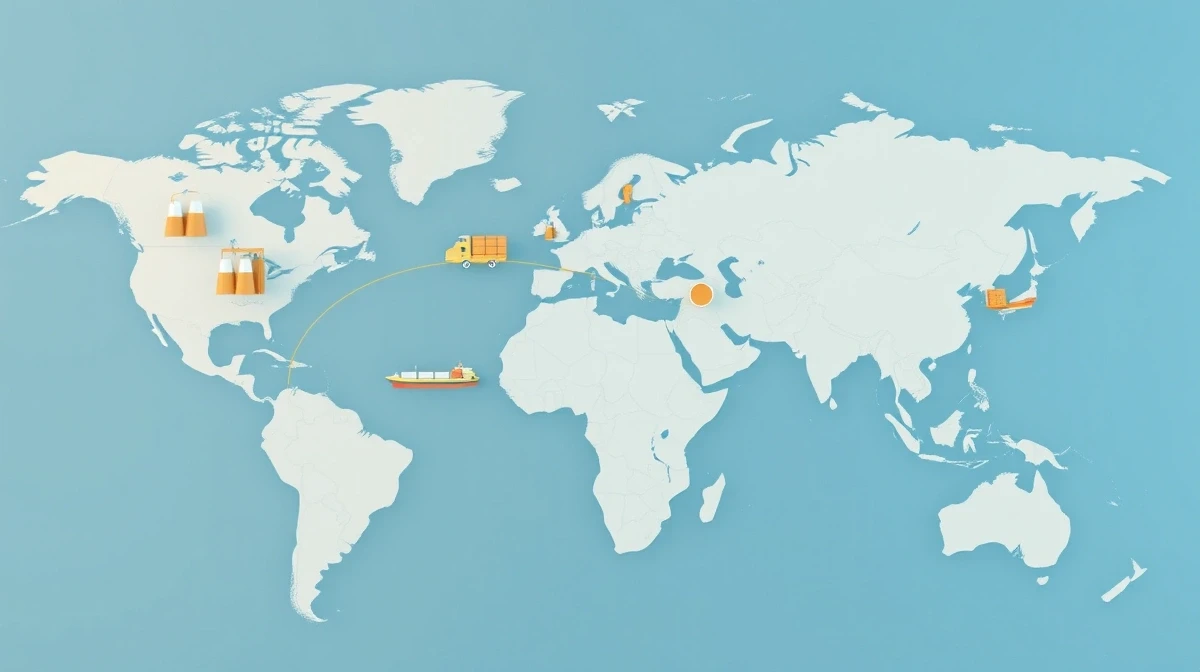
Le programme mondial gobelets en papier En 2024, le marché de gros de l'agroalimentaire représentera $18,2 milliards d'euros, avec 420 milliards d'unités fabriquées et distribuées dans les circuits de la restauration, de la vente au détail et de l'institutionnel. Derrière le rush matinal de chaque café et les soins prodigués aux patients de chaque hôpital se cache une chaîne d'approvisionnement complexe qui équilibre l'approvisionnement en matières premières, la capacité de production, l'expédition en conteneurs et la livraison en flux tendu. La compréhension de cette dynamique permet de distinguer les approvisionnements rentables des perturbations coûteuses.
Ce guide examine l'écosystème de la vente en gros de gobelets en papier, du fabricant à l'acheteur final, en analysant les structures de prix, les risques liés à la chaîne d'approvisionnement et les pratiques d'approvisionnement stratégiques pour les distributeurs, les grands opérateurs de services alimentaires et les entreprises d'exportation et d'importation.
Dans cet article, vous apprendrez :
-Structure du marché mondial et les principaux centres de production (Chine, Inde, Turquie)
-Dynamique des prix des matières premières aux coûts de revient
-Vulnérabilités de la chaîne d'approvisionnement et des stratégies d'atténuation des risques
-Logistique d'exportation et d'importation y compris les MOQ, les délais d'exécution et la documentation
💡 À emporter rapidement: Les prix de gros des gobelets en papier varient 300-500% globalement en fonction de l'accès aux matières premières, des coûts de main-d'œuvre et de la logistique.
Un gobelet de 12 oz revêtu de PE coûte $0,025-0,035 FOB Chine contre $0,025-0,035 FOB Chine.
$0.08-0.12 a débarqué en Amérique du Nord.
Les acheteurs stratégiques s'approvisionnent directement auprès des fabricants avec des délais de 60 à 90 jours, tandis que les commandes urgentes passées par l'intermédiaire de distributeurs donnent lieu à des primes de 40-80%.
Le marché de gros des gobelets en papier comprend les transactions B2B entre les fabricants, les distributeurs, les importateurs et les utilisateurs finaux à grande échelle qui achètent des gobelets en quantités supérieures à 10 000 unités par commande. Les principaux segments du marché sont les suivants
Catégories d'acheteurs :
Catégories de produits :
-Gobelets à paroi simple (4-24 oz) : 68% de volume
-Coupes à double paroi ou à triple paroi: 18% de volume
-Spécialité (impression personnalisée, matériaux de qualité supérieure): 14% de volume
🎯 Aperçu de l'industrieLe volume de vente en gros de gobelets en papier s'élève à 72% et passe par des distributeurs qui regroupent les commandes d'acheteurs de petite et moyenne taille.
Seul 28% est un produit fabriqué directement par le fabricant pour l'utilisateur final, généralement de grandes chaînes avec un approvisionnement centralisé (Starbucks, McDonald's, Sodexo).
Chine (45% de capacité globale) :
-Volume de production: ~190 milliards de tasses par an
-Avantage en termes de coûts: $0.020-0.030 FOB pour les gobelets standard de 12oz revêtus de PE
-Régions clés: Zhejiang (Wenzhou, Taizhou), Guangdong (Dongguan, Shenzhen), Jiangsu
-Points forts: Échelle massive, chaîne d'approvisionnement intégrée (papeteries, couchage, impression)
-Faiblesses: Variations de la qualité, problèmes de protection de la propriété intellectuelle, délais d'expédition de 20 à 35 jours vers les États-Unis et l'UE
Inde (12% de capacité globale) :
-Volume de production: ~50 milliards de tasses par an
-Coût: $0.025-0.035 FOB (coûts de main-d'œuvre et d'énergie légèrement plus élevés)
-Pleins feux sur l'exportation: Moyen-Orient, Afrique, Asie du Sud-Est (avantage géographique)
-Points forts: Langue anglaise, capacité d'investissement croissante
-Faiblesses: Goulets d'étranglement au niveau des infrastructures, alimentation électrique irrégulière
Turquie (8% de capacité globale) :
-Volume de production: ~34 milliards de tasses par an
-Coût: $0.035-0.045 FOB
-Avantage géographiqueExpédition en 7-12 jours vers l'UE, accès au Moyen-Orient et à l'Afrique du Nord
-Points forts: Cohérence de la qualité, alignement de la réglementation de l'UE
-Faiblesses: Taille limitée par rapport aux concurrents asiatiques
Amérique du Nord Domestique (15% de capacité globale) :
-Volume de production: ~63 milliards de tasses (principalement pour la consommation intérieure)
-Coût: $0.06-0.09 ex-factory (2-3× China FOB)
-Joueurs: Dart Container, Huhtamaki, Georgia-Pacific, Solo Cup
-Points forts: Aucun délai d'importation, qualité/certifications garanties
-Faiblesses: Coûts élevés de la main-d'œuvre et de l'énergie, concurrence limitée au niveau des prix
UE Domestique (10% de capacité globale) :
-Volume de production: ~42 milliards de tasses
-Coût: $0.07-0.11 ex-factory
-Réglementation: Conformité stricte en matière de contact alimentaire et d'environnement
-Tendance: Consolidation (les principaux acteurs acquièrent des usines plus petites)
Utilisation des capacités (2024) :
Éléments de coût (gobelet standard de 12 oz revêtu de PE) :
Tendances des prix des matières premières (2020-2025) :
Implication: Les prix de gros des gobelets en papier suivent de près les marchés de la pâte à papier et du polyéthylène avec un décalage de 2 à 3 mois. Les acheteurs profitent du blocage des prix pendant les creux de la pâte à papier (généralement T3-Q4).
Exemple d'exportation vers la Chine (gobelet de 12 oz, revêtement PE, MOQ 500 000 pcs) :
Structure de balisage du distributeur :
-Coût du distributeur: $0.03425 débarqué
-Entrepôt/manutention: +$0.008 par unité
-Marge du distributeur: 25-35% → +$0.011-0.015
-Prix de gros à l'acheteur: $0.053-0.057 par unité
-Balisage de la vente au détail (en cas de revente) : +30-50% → $0,069-0,086 par unité
Principaux résultats: Les importateurs qui achètent plus de 500 000 unités directement auprès des fabricants économisent 35-50% par rapport à l'achat auprès des distributeurs nationaux, mais ils doivent gérer des délais de 60 à 90 jours et l'assurance qualité.
Capacité du conteneur de 20 pieds :
40-Foot High-Cube Container :
-Capacité: 2,2-2,5× un conteneur de 20′
-Coût: 1,6-1,8× le coût du transport de 20′
-Économie de l'unité20-30% : meilleur coût de transport par tasse
Facteurs de coûts du fret maritime (2024-2025) :
Volatilité du marché du fret:
-2020-2021 (COVID) : Hausse des coûts de fret 300-500%
-2023-2024 : Normalisation à +60-80% par rapport à la ligne de base pré-COVID
-Stratégie de couverture: Les gros acheteurs négocient des contrats annuels avec les transporteurs pour obtenir des engagements de volume.
Gobelets standard/génériques (blanc/kraft, sans impression) :
-MOQ: 10 000-50 000 unités
-Délai de livraison7-15 jours (ex-stock dans l'entrepôt)
-Prix: L'investissement le plus élevé par unité (mais l'investissement total le plus faible)
-Cas d'utilisation: Commandes urgentes, petits opérateurs, achats d'essai
Stock + Logo Sticker :
-MOQ20 000 à 100 000 unités
-Délai de livraison: 15-25 jours (production du gobelet + application de l'autocollant)
-Prix: +10-15% vs. impression personnalisée complète
-Cas d'utilisation: Une image de marque sans dépassement de budget, la cohérence d'une franchise sans personnalisation complète
Impression personnalisée en 1 couleur :
-MOQ: 50 000 à 100 000 unités
-Délai de livraison25-35 jours (fabrication des plaques + production)
-Coût de la mise en place: $300-800 (fabrication de plaques/feuilles)
-Cas d'utilisation: Cafés, petites chaînes, marques simples
Impression personnalisée en couleur (CMYK) :
-MOQ: 100 000-300 000 unités
-Délai de livraison: 35-50 jours (approbation de la conception, assortiment des couleurs, production)
-Coût de la mise en place: $800-2,000
-Prix: +20-35% par rapport au stock, mais impact supérieur de la marque
-Cas d'utilisation: Grandes chaînes, marques haut de gamme, commerce de détail à haute visibilité
Entièrement sur mesure (taille/forme/matériau uniques) :
-MOQ: 300 000-1 000 000 unités (amortissement de l'outillage)
-Délai de livraisonDurée : 60 à 90 jours
-Coût de la mise en place: $3,000-10,000 (moules sur mesure, essais)
-Cas d'utilisation: Starbucks Reserve, éditions limitées, projets d'innovation
Les réalités de l'ordonnancement des fabricants :
-Haute saison (Q3-Q4, vacances) : Délais de 6 à 8 semaines, même pour les commandes en stock
-Basse saison (T1-T2) : Négocier des remises de 10-20% pour la production en période creuse
-Commandes urgentesPrime : 200-300% pour une production accélérée (si la capacité le permet)
Coûts de détention des stocks :
Recommandation: Commandez 2 à 3 mois d'approvisionnement pour les articles en stock à rotation rapide, 1 à 2 mois pour les créations personnalisées/saisonnières afin d'équilibrer les coûts et la flexibilité.
Points de contrôle critiques de la qualité :
Services d'inspection par des tiers :
-SGS, Intertek, TÜV: $500-1.200 par inspection (échantillon de 300-500 unités)
-Quand utiliser: Première commande d'un nouveau fournisseur, production >200 000 unités
-ROI: Prévient les pertes de $10.000-50.000 dues à des envois défectueux
Certifications essentielles :
Les drapeaux rouges dans la sélection des fournisseurs :
❌ Refus d'un audit de l'usine: Probablement des problèmes de capacité ou de qualité cachés
❌ Pas de certifications: Risque réglementaire, risque d'échec douanier
❌ Prix 30%+ inférieur au marché: Les coins sont coupés quelque part (matériel, main d'œuvre, sécurité)
❌ Refus de fournir des échantillons: Préoccupations en matière de qualité
❌ Aucune expérience en matière d'exportation: Erreurs de documentation, retards de livraison
Fabricant/Exportateur Fournit :
Acheteur/importateur Fournit :
-Licence d'importation (si requis dans le pays de destination)
-Identité fiscale / Enregistrement des importations
-Lettre de crédit (si le délai de paiement est L/C)
États-Unis :
-Code SH: 4823.69 (Autres articles en pâte à papier, papier, etc.)
-Taux du tarif: 0-5.5% (en fonction du matériau, du revêtement)
-Accords commerciaux: USMCA (0% du Canada/Mexique), SPG (variable)
L'Union européenne :
-Code SH: 4823.69
-Taux du tarif: 0-6.5%
-Barrières non tarifaires: Conformité REACH (sécurité chimique), réglementation relative au contact alimentaire
Royaume-Uni (après le Brexit) :
-Code SH: 4823.69
-Taux du tarif: 0-6.5% (aligné sur l'UE pour l'instant)
-Exigence unique: Marquage UKCA pour les matériaux en contact avec les aliments
Moyen-Orient (EAU, Arabie Saoudite) :
-Taux du tarif: 5-10%
-Certification Halal: Pas nécessaire pour les gobelets en papier, mais certains acheteurs le demandent.
-Normes SASO/ESMA: Certifications de sécurité des produits
Stratégies d'économies de droits :
-Zones de libre-échange: Importation dans la zone franche, paiement des droits uniquement lors de la mise sur le marché (report du flux de trésorerie).
-Entrepôts sous douane: Stocker des marchandises importées sans payer de droits de douane jusqu'à ce qu'elles soient vendues
-Ingénierie tarifaire: Ajuster les spécifications du produit pour qu'il puisse bénéficier d'une classification inférieure au code SH
Rétablissement des services alimentaires (après une pandémie) :
-2024: Trafic des services alimentaires à 102% des niveaux de 2019 (reprise complète + croissance)
-2025-2030 TCAC: 4,2% de croissance de la demande de gobelets en papier pour les services alimentaires
-Conducteur: Expansion des QSR, culture du café dans les marchés émergents
Mandats de développement durable :
-Interdiction des plastiques à usage unique72 pays avec des interdictions actives d'ici 2025 → substitution des gobelets en papier
-ESG de l'entreprise: Les grandes chaînes (McDonald's, Starbucks) s'engagent à utiliser 100% d'emballages durables d'ici 2025-2030.
-Préférences des consommateurs68% prêts à payer 5-10% de plus pour des options durables
Commerce électronique et livraison :
-Croissance de la livraison de repas: 12% CAGR (2024-2028) → augmentation de l'utilisation des gobelets à emporter.
-Cuisines fantômes: plus de 2 500 entreprises opérationnelles rien qu'aux États-Unis → achat de gobelets en vrac
Augmentation de la capacité :
-Inde: $2,1 milliards d'investissements dans la capacité d'emballage papier (2024-2027).
-Asie du Sud-Est: Le Vietnam et l'Indonésie augmentent leur production (avantage en termes de coût de la main-d'œuvre)
-Nearshoring: Le Mexique ajoute 3 grandes usines pour desservir le marché américain (réduction des délais et des coûts d'expédition).
Innovation matérielle :
-Revêtements à base d'eau: Adoption de 18% en 2024 → projection de 45% d'ici 2028 (recyclabilité)
-Revêtements PLA: 12% en 2024 → 22% en 2028 (demande de compostabilité)
-Technologie des barrières: Revêtements minéraux (non plastiques) émergents (adoption actuelle de 3%)
Perspectives de tarification (2025-2030) :
## Recommandations en matière d'approvisionnement stratégique
Petites chaînes (50 000-200 000 tasses/mois) :
-Stratégie: Achat auprès de distributeurs nationaux pendant les 1 à 2 premières années (minimiser la complexité)
-Transition: Dès que le volume dépasse 200 000 unités/mois, tester l'importation directe (1-2 conteneurs).
-Nombre de fournisseurs: Maintenir 2 fournisseurs (principal + de secours) pour atténuer les risques
Chaînes moyennes (500 000-2 000 000 tasses/mois) :
-Stratégie: Importation directe de 1 à 2 fabricants asiatiques (Chine/Inde), sauvegarde nationale
-Contrat: Engagements de volume annuel pour les réductions de prix 5-10%
-Qualité: Recourir à une inspection par un tiers (SGS) pour chaque expédition
Grandes entreprises (5 000 000+ tasses/mois) :
-Stratégie: Multi-sources (Asie primaire, domestique secondaire, nearshore émergent)
-Partenariats manufacturiers: Co-investir dans des lignes de production dédiées à des spécifications particulières
-Logistique: Contracter directement avec les compagnies maritimes (éviter les majorations des transitaires)
-Couverture: Instruments financiers pour bloquer les coûts des matières premières (contrats à terme sur la pâte à papier)
Points d'appui :
1.Engagements de volume: Garantie de prévision sur 12 mois pour la remise 8-12%
2.Conditions de paiement: Le paiement anticipé (dépôt de 50%) permet de bénéficier d'une concession tarifaire de 3-5%.
3.Flexibilité: Accepter des délais de livraison plus longs (90 jours contre 60) pour les économies réalisées sur le 5-8%
4.Production hors pointe: Commandez en Q1-Q2 (basse saison) pour des remises de 10-15%
Lignes rouges (ne pas faire de compromis) :
-Certifications de qualité: Toujours exiger la conformité FDA/UE (non négociable)
-Droits d'inspection: Se réserve le droit de procéder à un audit de l'usine avant toute commande importante
-Force Majeure: Limiter la responsabilité en cas de rupture de la chaîne d'approvisionnement, mais assurer un approvisionnement de secours
❌ Erreur #1: Choisir un fournisseur uniquement sur la base du prix le plus bas sans audit de l'usine
✅ Approche correcte: Visiter l'usine ou engager un inspecteur tiers pour les commandes >$50 000. Vérifier l'âge des équipements, les sources de matières premières, les contrôles de qualité.
❌ Erreur #2: Commander exactement ce dont vous avez besoin avec zéro tampon
✅ Approche correcte: Ajouter le stock de sécurité 3-5% à la commande. Des retards d'expédition, des rejets de qualité et des pics de demande peuvent survenir - le stock de sécurité permet d'éviter les ruptures de stock.
❌ Erreur #3: Paiement par virement bancaire avant production/inspection
✅ Approche correcte: Utiliser une lettre de crédit ou des services de dépôt fiduciaire pour les 2 ou 3 premières commandes. Débloquer 70% à l'inspection, 30% à la livraison.
❌ Erreur #4: Ignorer l'optimisation de la classification tarifaire
✅ Approche correcte: Travailler avec un courtier en douane pour vérifier le code HS. De petites modifications des spécifications peuvent faire passer le tarif de 5,5% à 0%.
Le marché de gros des gobelets en papier comprend des transactions B2B où les acheteurs achètent 10 000+ unités par commande auprès de fabricants ou de distributeurs. Il représentera $18,2 milliards d'euros en 2024 (420 milliards d'unités) dans les secteurs de la restauration, des institutions et de la vente au détail.
Les MOQ varient en fonction de la personnalisation : 10 000-50 000 pour les gobelets en stock, 50 000-100 000 pour l'impression en une couleur, 100 000-300 000 pour l'impression complète en CMJN et 300 000-1 000 000 pour les tailles/formes personnalisées. L'économie du chargement de conteneurs favorise les commandes de plus de 500 000 unités pour l'importation.
Gobelets standard de 12 oz revêtus de PE : $0.020-0.030 FOB Chine, $0.035-0.045 FOB Turquie, $0.06-0.09 départ usine Amérique du Nord, $0.053-0.057 auprès des distributeurs américains (prix au débarquement + majoration). Le revêtement PLA compostable ajoute une prime de 20-35%.
Stock/générique : 7-15 jours, impression personnalisée : 25-50 jours, le fret maritime ajoute 14-38 jours (Chine→US), cycle complet de la commande à la livraison : 45-90 jours pour les importations, 15-30 jours pour les produits nationaux. La haute saison (Q3-Q4) ajoute 2 à 4 semaines.
La Chine produit 45% de la capacité mondiale (~190 milliards de tasses/an), l'Inde 12%, la Turquie 8%, l'Amérique du Nord 15%, l'UE 10%. La Chine offre les coûts FOB les plus bas ($0,020-0,030) mais le transport est le plus long. La Turquie offre l'avantage de la proximité de l'UE.
FDA Contact alimentaire Notification (marché américain), Règlement (CE) n° 10/2011 (Europe), FSC/PEFC (sylviculture durable), ISO 9001 (gestion de la qualité). Des tests effectués par des tiers (SGS, Intertek) sont recommandés pour les premières commandes et les expéditions de plus de 200 000 unités.
Approvisionnement direct du fabricant (économie de 35 à 50% par rapport aux distributeurs), commandes par conteneurs (500 000+ unités), engagements de volume annuel (réduction de 8 à 12%), production en période creuse (Q1-Q2, réduction de 10 à 15%), concurrence multi-sourcing, optimisation des délais de paiement (le prépaiement débloque 3 à 5%).
Le marché de gros des gobelets en papier fonctionne comme un écosystème mondial complexe où la volatilité des matières premières, la capacité de production, la logistique d'expédition et la conformité réglementaire s'entrecroisent pour déterminer les prix et la disponibilité. Les acheteurs qui réussissent à naviguer dans ce paysage ne procèdent pas par des achats transactionnels ponctuels, mais par des relations stratégiques avec les fournisseurs, la diversification de la chaîne d'approvisionnement et une gestion proactive de la qualité.
Principaux enseignements :
1.L'arbitrage des coûts géographiques est important: FOB Chine ($0.020-0.030) vs. Amérique du Nord ($0.06-0.09) génère des économies de 35-50% pour les importateurs prêts à gérer des délais de 60-90 jours.
2.L'économie des chargements de conteneurs est importante: 500 000+ commandes unitaires optimisent les coûts de transport (40%+ d'économies par unité par rapport au fret LCL/air)
3.L'assurance qualité n'est pas négociable: L'inspection par un tiers ($500-1,200) permet d'éviter $10,000-50,000 pertes dues à des envois défectueux.
4.L'externalisation multiple atténue les risques: Le principal fournisseur asiatique + les renforts nationaux équilibrent les coûts et la sécurité de l'approvisionnement.
5.Le développement durable détermine la tarification future: Les revêtements à base d'eau/PLA commandent des primes 20-35% aujourd'hui mais deviendront une référence lorsque les réglementations se durciront (2025-2030).
Que vous soyez un distributeur qui consolide ses approvisionnements, une chaîne de restauration rapide qui optimise ses achats ou un importateur qui constitue un portefeuille de produits papetiers, la compréhension de la dynamique de la chaîne d'approvisionnement vous permet de négocier de meilleures conditions, de gérer les risques de manière proactive et de tirer parti des inefficacités du marché qui séparent les opérations rentables de l'érosion des marges.
-Emballages alimentaires Conteneurs
-Services d'exportation et de gros
Papacko fabrique et exporte des gobelets en papier dans plus de 45 pays, avec une capacité de production de 12 milliards d'unités par an. Nous proposons des quantités minimales de 50 000 unités, des matériaux certifiés FDA/EU et des expéditions directes par conteneur complet. Notre chaîne d'approvisionnement comprend une planification de la production sur 60 jours, une inspection SGS avant expédition et la gestion des documents d'exportation.
Prenez contact avec nous :
Dernière mise à jour: novembre 2025