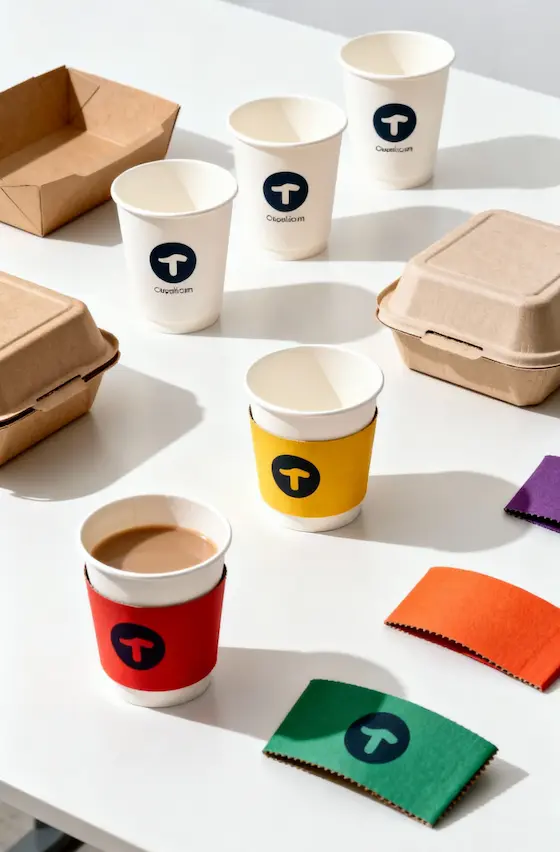
هل أنت مستعد لإنشاء أكواب ورقية أو عبوات ورقية تحمل علامتك التجارية الخاصة بك؟
أخبرنا بمتطلباتك - الحجم والطلاء والطباعة والوجهة - وسيقوم فريقنا بإعداد عرض أسعار مفصل في غضون 24 ساعة.
آخر تحديث: August 2026
وقت القراءة: 8-10 دقائق
المؤلف: فريق محتوى باباكو
العالمية أكواب ورقية market has experienced unprecedented transformation over the past five years, driven by sustainability regulations, shifting consumer preferences, and the rapid expansion of coffee culture across emerging economies. In 2026, the industry stands at a pivotal inflection point: market value has reached $14.8 billion USD, with projections indicating 6.2% compound annual growth rate (CAGR) through 2030—but regional dynamics, material innovations, and regulatory landscapes are creating winners and losers.
This comprehensive industry report analyzes the global paper cups market in 2026: detailed market size data across regions, growth rate comparisons (Asia-Pacific major at 8.7% CAGR vs mature North American markets at 3.4%), sustainability drivers reshaping manufacturing, the quantified impact of single-use plastic bans in 40+ jurisdictions, and evidence-based forecasts for 2026-2030. Whether you’re a manufacturer, distributor, café chain, or investor, understanding these dynamics is essential for strategic planning.
الوجبات السريعة: The global paper cups market reached $14.8 billion in 2026, growing at 6.2% CAGR.
Asia-Pacific leads regional growth (8.7% CAGR), driven by coffee culture expansion and urbanization.
Single-use plastic bans in 40+ regions shifted 12-18 billion units annually from plastic to paper.
Compostable coatings (PLA, water-based) now represent 32% of production, up from 18% in 2022.
The key to choosing paper cups market depends on:
2026 Global Market: $14.8 billion USD
2025 Market: $13.9 billion USD
YoY Growth: +6.5% (2025-2026)
5-Year CAGR (2021-2026): 5.8%
Projected 2030 Market: $18.9 billion USD
5-Year Forecast CAGR (2026-2030): 6.2%
Volume metrics (2026):
-Global production: 264 billion units
-Per capita consumption: 33 cups/person/year (global average)
-Hot beverage cups: 178 billion units (67%)
-Cold beverage cups: 86 billion units (33%)
Understanding cups market requires attention to these factors:
Key trend: Cold beverage cups growing faster (7.8% vs 5.4% for hot) due to iced coffee, bubble tea, smoothie culture expansion, particularly in Asia-Pacific and Latin America.
The key to choosing common paper cups market depends on:
رؤية نقدية: Compostable coatings (PLA + water-based + BioPBS) collectively reached 36% market share in 2026, up from 19% in 2022. This represents the fastest-growing segment (18.5% CAGR) and is expected to reach 52% share by 2030.

When evaluating various paper cups market, consider the following:
2026 Market Size: $5.8 billion (39% of global market)
CAGR 2026-2030: 8.7%
الحجم: 112 billion units (42% of global production)
Key markets:
-الصين: $2.4 billion (largest single country market, 8.9% CAGR)
-الهند: $1.1 billion (fastest growing, 11.2% CAGR)
-اليابان: $0.9 billion (mature but stable, 4.1% CAGR)
-جنوب شرق آسيا: $1.4 billion (Indonesia, Vietnam, Thailand driving growth at 9.3% combined CAGR)
Growth drivers:
-Urbanization: 60% of Asia-Pacific population now urban (up from 52% in 2020)
-Coffee culture expansion: Café density in Tier 1 Chinese cities up 140% since 2020
-Disposable income growth: Middle class expansion in India, Vietnam, Indonesia
-QSR (Quick Service Restaurant) proliferation: Western chains + local competitors
التحديات:
-Price sensitivity: Average unit price 40-50% lower than Western markets
-Informal sector dominance: 35-45% of beverages served in reusable or unregulated containers
-Infrastructure gaps: Limited commercial composting for compostable cups
When evaluating different paper cups market, consider the following:
2026 Market Size: $4.2 billion (28% of global market)
CAGR 2026-2030: 3.4%
الحجم: 68 billion units (26% of global production)
Per capita consumption: 185 cups/person/year (highest globally)
Key dynamics:
-الولايات المتحدة الأمريكية: $3.6 billion (85% of regional market)
-Canada: $0.6 billion (strong sustainability focus, 4.8% CAGR)
Growth drivers:
-Specialty coffee segment growth: Third-wave cafés expanding 6-8% annually
-Compostable cup adoption: 45% of new production in 2026 (up from 22% in 2022)
-Premium positioning: Average selling price increased 12% (2022-2026) due to eco-products
-Office return trends: Post-pandemic office occupancy stabilizing at 65-75%, driving institutional demand
Market saturation factors:
-Coffee shop density plateauing in major metros
-Reusable cup campaigns reducing disposable consumption 8-12% in sustainability-focused cities
-Mature per capita consumption (limited room for volume growth)
Regulatory impact:
-18 cities/states with single-use plastic bans (affecting 85 million people)
-Extended Producer Responsibility (EPR) laws in 8 states requiring manufacturer-funded recycling
-Compostability labeling requirements in California, Oregon, Washington
For the paper cups market, focus on:
2026 Market Size: $3.4 billion (23% of global market)
CAGR 2026-2030: 4.9%
الحجم: 58 billion units (22% of global production)
Per capita consumption: 112 cups/person/year
Key markets:
-ألمانيا: $0.8 billion (strict regulations driving compostable adoption)
-UK: $0.7 billion (plastic ban impact significant)
-فرنسا: $0.5 billion (reusable cup deposit schemes slowing disposable growth)
-Italy/Spain: $0.6 billion combined (espresso culture transitioning to takeaway)
-Nordic region: $0.3 billion (highest compostable percentage at 68%)
Growth drivers:
-EU Single-Use Plastics Directive: Banned PE-coated cups unless recyclable (2024 implementation)
-Deposit return schemes: Germany, Netherlands, Nordics requiring €0.10-0.25 deposits
-Compostable infrastructure: Commercial composting coverage reaching 65% of urban areas
-Coffee-to-go culture: Southern Europe adopting takeaway trends from Northern Europe
Unique challenges:
-Fragmented regulations: 27 EU member states + UK with varying implementation
-Reusable alternatives: Aggressive government-backed reusable cup programs in France, Germany
-Higher cost sensitivity: Economic pressures limiting premium eco-product adoption in Eastern Europe
Coating preference:
-42% PLA compostable (highest globally)
-15% water-based dispersion coatings
-32% PE (legacy, declining rapidly)
-11% other (wax, experimental coatings)
For cups market, focus on:
2026 Market Size: $1.0 billion (7% of global market)
CAGR 2026-2030: 7.2%
الحجم: 18 billion units (7% of global production)
Key markets:
-Brazil: $0.5 billion (coffee origin country with growing takeaway culture)
-Mexico: $0.3 billion (proximity to US driving QSR expansion)
-Argentina/Chile: $0.2 billion combined
Growth drivers:
-Urbanization and café culture in São Paulo, Mexico City, Buenos Aires
-US-based QSR chains expanding into secondary cities
-Growing environmental awareness in urban middle class
Barriers to faster growth:
-Economic volatility and currency fluctuations
-Lower disposable incomes limiting premium product adoption
-Strong reusable container culture in traditional markets
Understanding standard paper cups market requires attention to these factors:
2026 Market Size: $0.4 billion (3% of global market)
CAGR 2026-2030: 9.8% (second-highest regional growth)
الحجم: 8 billion units (3% of global production)
Key markets:
-UAE/Saudi Arabia: Premium coffee culture in Dubai, Riyadh driving demand
-South Africa: Most developed market in Africa (70% of regional volume)
-Egypt: Emerging café culture in Cairo
Growth catalysts:
-Young, urban populations in GCC countries
-Tourism and hospitality sectors recovering post-2020
-International coffee chains entering markets
التحديات:
-Limited local manufacturing (90% imported from Asia-Pacific, Europe)
-Infrastructure gaps for waste management and recycling
-Price sensitivity in African markets

When evaluating various paper cups market, consider the following:
Global regulatory landscape (2026):
-40+ national or regional jurisdictions with bans/restrictions on plastic-coated cups
-Affecting estimated 1.2 billion people (15% of global population)
-Shifted 12-18 billion cups annually from plastic to paper or reusable alternatives
Major implementations:
Unintended consequences:
-Increased demand outpaced compostable coating supply in 2024 (prices spiked 18-25%)
-Insufficient composting infrastructure led to compostable cups in landfills (defeating purpose)
-Some jurisdictions saw 8-15% shift to reusables (not all plastic volume went to paper)
Understanding the paper cups market requires attention to these factors:
2026 Consumer survey data (10,000 respondents across 15 countries):
-72% prefer compostable cups vs PE-coated (up from 58% in 2022)
-64% willing to pay €0.05-0.15 premium for certified compostable cups
-48% actively seek BPI/FSC/TÜV logos when purchasing beverages
-35% report using reusable cups at least weekly (up from 22% in 2021)
Generational differences:
-Gen Z (18-26): 81% prioritize sustainability, 52% use reusables regularly
-Millennials (27-42): 75% prioritize sustainability, 42% use reusables
-Gen X (43-58): 64% prioritize sustainability, 28% use reusables
-Boomers (59+): 52% prioritize sustainability, 18% use reusables
Brand impact:
-Café chains reporting sustainability credentials see 12-18% higher customer loyalty scores
-58% of consumers notice cup material/certification (up from 34% in 2020)
-Negative brand perception: 67% view companies still using PE-coated cups as “behind the times”
The key to choosing various paper cups market depends on:
Third-party certification adoption (2026 vs 2022):
Regulatory requirements driving adoption:
-EU mandates FSC or equivalent for public procurement (65% of institutional market)
-California requires شهادة BPI for “compostable” marketing claims
-France requires EN 13432 certification for composting symbol use
When evaluating paper cups market, consider the following:
Investment in R&D (2026):
-Global paper cup coating R&D spend: $420 million (up 35% from 2023)
-Focus areas: PFAS-free barriers (40%), improved recyclability (30%), cost reduction (20%), performance enhancement (10%)
Emerging technologies nearing commercialization:
1. Nano-cellulose coatings:
-Status: Pilot production in 3 Scandinavian mills
-Advantage: 100% bio-based, excellent moisture barrier, recyclable
-Challenge: Cost (3-4x current PLA pricing), scaling production
-Commercialization timeline: 2027-2028 for premium segment
2. Algae-based coatings:
-Status: Lab-scale testing, pre-commercial trials
-Advantage: Carbon-negative (absorbs CO₂ during algae growth), compostable
-Challenge: Stability in hot liquids, supply chain development
-Timeline: 2029-2030 potential market entry
3. Mineral-based barriers:
-Status: Limited commercial availability (Japan, South Korea)
-Advantage: PFAS-free, recyclable in standard paper streams
-Challenge: Brittleness at low temperatures, higher weight
-Adoption: 2% of Asia-Pacific market, expanding to Europe 2027
The key to choosing the paper cups market depends on:
Automation and digitalization:
-Average paper cup production line speed: 140 cups/minute (2026) vs 110 cups/minute (2020), +27% efficiency
-Defect rates reduced to 0.8% (from 1.5% in 2020) via AI-powered quality control
-Energy consumption per 1,000 cups: -18% through optimized heating/forming cycles
Sustainable manufacturing practices:
-42% of global production now uses renewable energy (up from 28% in 2022)
-Water recycling in manufacturing: 65% average (up from 48%)
-Waste-to-energy integration: 38% of mills (production scraps fuel boilers)
When evaluating different paper cups market, consider the following:
Market concentration:
-Top 5 manufacturers: 42% market share
-Top 10: 58%
-Highly fragmented with 200+ manufacturers globally
-Trend toward consolidation: 8 major M&A transactions in 2024-2026 period
For paper cups market, focus on:
Manufacturer strategies:
-35% of leadwell-knownufacturers now own coating production (up from 22% in 2020)
-18% vertically integrated into paperboard mills (controlling raw materials)
-52% have captive printing capabilities (vs outsourcing)
Advantages of integration:
-8-12% cost reduction through supply chain control
-Faster innovation cycles (coating development to production)
-Better quality control and consistency
For cups market, focus on:
Base case scenario (6.2% CAGR):
-2030 market size: $18.9 billion
-Volume: 340 billion units (+29% vs 2026)
-Assumptions: Continued urbanization, moderate plastic ban expansion, steady sustainability trend
Optimistic scenario (7.8% CAGR):
-2030 market size: $20.8 billion
-Volume: 365 billion units (+38% vs 2026)
-Catalysts: Aggressive global plastic bans, breakthrough in cost-effective compostable coatings, emerging market acceleration
Conservative scenario (4.5% CAGR):
-2030 market size: $17.3 billion
-Volume: 310 billion units (+17% vs 2026)
-Risks: Economic slowdown, successful reusable cup campaigns, regulatory complexity slowing adoption
For cups market, focus on:
### Product Segment Projections
The key to choosing paper cups market depends on:
Fastest growing segments (2026-2030):
1.Understanding different paper cups market helps.Cold beverage cups (12-24 oz): 7.8% CAGR (iced coffee, bubble tea, smoothies driving demand)
2.Understanding paper cups market helps.Compostable coated cups: 18.5% CAGR (regulatory push + consumer preference)
3.Understanding the paper cups market helps.Premium specialty cups: 9.2% CAGR (third-wave coffee shops, customization)
Declining/stable segments:
1.أكواب مطلية بالبولي إيثيلين: -2.5% CAGR (regulatory phase-out in major markets)
2.Understanding cups market helps.Vending/institutional: 2.8% CAGR (office coffee culture shifting to café-style)
3.Wax-coated cups: -5.8% CAGR (obsolete technology, poor recyclability)
When evaluating paper cups market, consider the following:
Notable acquisitions:
-Huhtamaki acquired regional Asian manufacturer for $280M (expanding low-cost production)
-Private equity investment in European sustainable packaging: $450M+ across 5 deals
-Chinese manufacturer consolidated 3 smaller competitors ($180M total)
Investment themes:
-Compostable coating capacity expansion: $650M invested globally (2024-2026)
-Manufacturing automation: $380M in new high-speed production lines
-Geographic expansion: $520M for Asia-Pacific capacity by Western manufacturers
IPO activity:
-2 specialty sustainable packaging companies went public (2025-2026)
-Combined market cap: $1.8 billion
-Investor interest: ESG funds driving 40% of capital raised
Composting facilities:
-Only 28% of global population has access to commercial composting accepting BPI-certified cups
-Mismatch: 36% of cups are compostable, but <30% can be properly processed
-Investment need: Estimated $15-20 billion globally to achieve 60% composting coverage
Recycling contamination:
-45-60% of paper cups end up in landfills despite recyclable/compostable design
-Contamination rates: 15-25% of recycling streams (food residue, mixed materials)
-Education gap: 62% of consumers don’t know how to properly dispose of different cup types
Raw material volatility:
-Paperboard prices increased 22% (2020-2026) due to forest products demand
-PLA resin prices volatile: $2,200-3,400/ton (depends on corn prices)
-Energy costs impacting manufacturing margins (especially Europe)
Margin compression:
-Average manufacturer margins: 8-12% (down from 12-15% in 2020)
-Price competition intense in commoditized PE-coated segment
-Compostable premium narrowing as volumes scale (40% premium in 2022, now 25%)
Fragmented standards:
-15+ different compostability standards globally (EN 13432, ASTM D6400, AS 4736, etc.)
-Manufacturers must certify products for multiple markets (cost and complexity)
-Conflicting requirements: Some regions accept PLA, others require recyclability
المسؤولية الموسعة للمنتج (EPR):
-12 jurisdictions now require manufacturers to fund collection/processing
-Costs: €0.02-0.08 per cup (8-15% of unit cost)
-Administrative burden: Reporting, tracking, compliance systems
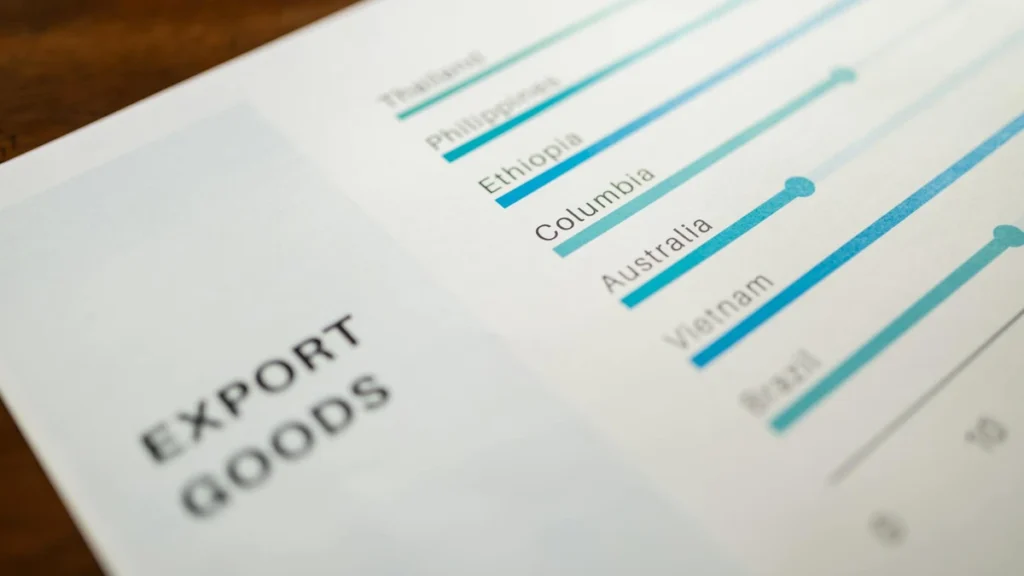
The global paper cups market reached $14.8 billion USD in 2026, growing 6.5% year-over-year from $13.9 billion in 2025. The industry produced 264 billion units in 2026, with hot beverage cups representing 67% of volume (178 billion units) and cold beverage cups 33% (86 billion units). The market is projected to grow at 6.2% compound annual growth rate (CAGR) from 2026-2030, reaching $18.9 billion by 2030. Asia-Pacific accounts for the largest regional share at 39% ($5.8 billion), followed by North America at 28% ($4.2 billion) and Europe at 23% ($3.4 billion).
Asia-Pacific leads global growth with 8.7% CAGR projected for 2026-2030, driven by rapid urbanization (60% urban population), expanding coffee culture (café density in Chinese cities up 140% since 2020), and rising middle-class incomes, paper cups market matter.India shows the fastest country-level growth at 11.2% CAGR, while Southeast Asia (Indonesia, Vietnam, Thailand) collectively grows at 9.3% CAGR. China remains the largest single country market at $2.4 billion with 8.9% growth rate. Middle East & Africa shows second-highest regional growth at 9.8% CAGR but from a much smaller base ($0.4 billion market size), while mature markets like North America (3.4% CAGR) and Europe (4.9% CAGR) grow more slowly.
Single-use plastic bans in 40+ jurisdictions have shifted 12-18 billion cups annually from plastic to paper alternatives, representing approximately 6-8% of total global paper cup production in 2026, various paper cups market matter.Major regulatory implementations include the EU Single-Use Plastics Directive (affecting 27 countries, adding 8-12 billion paper cups annually), Canada’s 2023 ban (adding 1.2 billion units), and China’s phased city-level bans (adding 3-5 billion units). These regulations accelerated compostable coating adoption from 18% market share in 2022 to 32% in 2026. Though bans also drove unintended consequences including 18-25% price spikes for compostable coatings in 2024 and 8-15% shifts to reusable alternatives than direct plastic-to-paper conversion.
Compostable coatings (PLA, water-based dispersion, and BioPBS/PBAT) collectively represent 36% of global paper cup production in 2026, up dramatically from 19% in 2022. Understanding the paper cups market helps.PLA (حمض البوليلاكتيك) coating alone accounts for 24% market share, water-based dispersion coatings 8%, and BioPBS/PBAT 4%. Traditional PE (polyethylene) coating still dominates at 58% but has declined from 72% in 2022. Regional variation is significant: Nordic countries lead with 68% compostable adoption, Europe overall at 57%, North America at 45%, while Asia-Pacific lags at 28% due to cost sensitivity. The compostable segment grows fastest at 18.5% CAGR and is projected to reach 52% global market share by 2030.
Four major sustainability drivers are transforming the industry: (1) Regulatory pressure from 40+ jurisdictions with single-use plastic bans, affecting 1.2 billion people and shifting billions of units to paper/compostable alternatives; (2) Consumer preferences with 72% preferring compostable cups (up from 58% in 2022) and 64% willing to pay €0.05-0.15 premium for certified products; (3) Third-party certifications with FSC adoption reaching 58% of production (up 16 points since 2022) and BPI compostable certification doubling to 18%; (4) Corporate sustainability commitments with major café chains pledging 100% compostable/recyclable packaging by 2025-2028, driving manufacturer innovation, various paper cups market matter.These forces collectively shifted $4.2 billion in market value toward sustainable products over four years.
The global paper cups market is projected to reach $18.9 billion USD in 2030 under base-case scenarios, representing 6.2% CAGR from 2026. Production volume will grow to 340 billion units (+29% vs 2026’s 264 billion units). Regional projections show Asia-Pacific reaching $8.2 billion (8.7% CAGR), North America $4.9 billion (3.4% CAGR), and Europe $4.2 billion (4.9% CAGR). Optimistic scenarios with aggressive plastic bans and breakthrough innovations could drive the market to $20.8 billion (7.8% CAGR), while conservative scenarios accounting for economic slowdowns and successful reusable campaigns project $17.3 billion (4.5% CAGR). Compostable cups are expected to grow fastest at 18.5% CAGR, reaching 52% market share by 2030.
The paper cups market remains fragmented with the top 5 manufacturers holding 42% combined market share in 2026. LeaTopmpanies include: Huhtamaki Oyj (12% global share, vertically integrated with strong European and Asian presence), Dart Container (10%, dominant in North America with diverse portfolio), Greiner Packaging (8%, innovation-focused serving European and North American premium segments), Konie Cups (7%, Asia-Pacific cost leader), and Benders Paper Cups (5%, European sustainability positioning). The remaining 58% is split among 200+ regional and local manufacturers. Industry consolidation is accelerating with 8 major M&A transactions during 2024-2026, driven by economies of scale, vertical integration strategies (35% now own coating production), and geographic expansion particularly in high-growth Asia-Pacific markets.
The global paper cups market in 2026 stands at a transformative inflection point, driven by sustainability regulations, shifting consumer preferences, and geographic expansion in emerging economies. At $14.8 billion with 264 billion units produced annually, the industry projects 6.2% CAGR growth through 2030, but regional dynamics vary dramatically—from Asia-Pacific’s 8.7% explosive growth fueled by coffee culture adoption to North America’s mature 3.4% expansion focused on premiumization and compostability.
الوجبات السريعة الرئيسية:
1.Understanding common paper cups market helps.Regional divergence—Asia-Pacific and MEA lead growth (8-10% CAGR), mature markets shift to sustainability
2.Understanding common paper cups market helps.Regulatory reshaping—40+ jurisdictions with plastic bans shifted 12-18 billion cups, driving compostable adoption
3.Understanding the paper cups market helps.Coating revolution—Compostable share jumped from 19% (2022) to 36% (2026) — targeting 52% by 2030
4.Understanding various paper cups market helps.Fragmentation persists—Top 5 manufacturers hold only 42% share despite consolidation trends
5.Understanding paper cups market helps.Infrastructure gap—Only 28% of population has composting access, limiting circular economy potential
-Global Packaging Sustainability Trends
Papacko serves clients across 40+ countries with production capacity exceeding 2 billion cups annually. Understanding cups market helps.Our range includes traditional PE-coated, PLA compostable, and water-based barrier cups in 4-24 oz sizes—with شهادة FSC, BPI compostability verification, and full customization capabilities. We support distributors, importers, café chains, and foodservice operators navigating the transition to sustainable packaging.
Market-size research usually leads buyers into supplier screening, chain procurement standards, export readiness, and the commercial cup ranges that can actually support those decisions.
تواصل معنا