¿Está listo para crear sus propios vasos o envases de papel con su marca?
Díganos sus requisitos -tamaño, revestimiento, impresión y destino- y nuestro equipo le preparará un presupuesto detallado en 24 horas.
Papacko’s 2026 annual sustainability report marks a transformative year in our journey toward carbon neutrality and circular economy leadership within the food packaging industry. This report transparently details our environmental performance across operations, product innovation, supply chain optimization, and stakeholder engagement—demonstrating measurable progress against 2025 commitments while establishing ambitious targets for 2027-2030.
In 2026, Papacko achieved several milestone sustainability outcomes: 42% reduction in Scope 1+2 carbon emissions vs 2020 baseline, 78% of product portfolio certified compostable or recyclable (up from 61% in 2025), zero waste to landfill status at three manufacturing facilities, and 100% renewable energy procurement for European operations. These achievements position Papacko among the top 5% of food packaging manufacturers globally in ESG performance, as verified by third-party EcoVadis Platinum rating (scored 82/100, top 1% in industry).
This comprehensive report provides stakeholders—customers, investors, employees, regulators, and communities—with transparent data on our environmental impact, social responsibility initiatives, governance frameworks, and forward-looking sustainability roadmap. We detail carbon footprint reductions, renewable material adoption rates, waste diversion metrics, water conservation achievements, supplier engagement outcomes, and community investment programs that collectively define Papacko’s commitment to planetary and social well-being.
💡 Comida rápida para llevar: Papacko’s 2026 sustainability highlights include 42% carbon emission reduction (Scope 1+2) vs 2020, 78% compostable/recyclable product portfolio, zero waste to landfill at three facilities, 100% renewable energy in Europe, EcoVadis Platinum rating (82/100, top 1%), and 2030 targets of carbon neutrality, 95% sustainable materials, and closed-loop recycling systems across all manufacturing sites.
1.Carbon reduction acceleration: Achieved 42% reduction vs 2020 baseline, surpassing 2026 interim target of 35%
2.Renewable energy leadership: European facilities powered by 100% renewable electricity (solar + wind PPAs)
3.Zero waste facilities: Hangzhou, Rotterdam, and Guadalajara plants achieved zero waste to landfill certification
4.Innovación de materiales: Launched heat-resistant PLA cup line and mushroom mycelium tray pilot (carbon-negative materials)
5.EcoVadis Platinum: Scored 82/100, placing Papacko in top 1% of global packaging manufacturers for sustainability
6.Supplier engagement: 72% of suppliers (by spend) verified ESG-compliant via third-party audits, up from 44% (2025)
7.Community investment: $1.2M invested in environmental education programs and compost infrastructure grants
-2020 baseline: 21,500 tCO₂e
-2025: 15,200 tCO₂e (-29% vs 2020)
-2026: 12,450 tCO₂e (-42% vs 2020, -18% vs 2025)
-2030 target: Net zero (carbon neutral via 85% reduction + 15% high-quality offsets)
Carbon intensity (emissions per tonne product):-2026: 0.42 tCO₂e/tonne product
-2025: 0.51 tCO₂e/tonne product (-18% improvement)
-2020: 0.72 tCO₂e/tonne product (-42% improvement)
Reduction drivers:1.Contratación de energía renovable: 68% renewable electricity (up from 46% in 2025), including 100% renewable in Europe
2.Energy efficiency investments: LED lighting retrofits (-12% energy), HVAC optimization (-18% energy), heat recovery systems (-15% natural gas)
3.Fleet electrification: 35% of company vehicles now electric (up from 18% in 2025)
4.Material lightweighting: Average cup/tray weight reduced 8% via design optimization, reducing raw material emissions
-Europa: 100% renewable (combination on-site solar + wind PPAs)
-Norteamérica: 52% renewable (RECs + grid mix)
-Asia-Pacífico: 58% renewable (on-site solar + grid mix in China)
-América Latina: 48% renewable (on-site solar + grid hydro in Mexico/Brazil)
2027-2030 renewable roadmap:-2027: Install 3.5 MW additional solar capacity (North America facilities), reaching 75% renewable
-2028: Sign wind PPA for North America operations, reaching 88% renewable
-2029: Complete on-site solar + battery storage at all facilities, reaching 95% renewable
-2030: Achieve 100% renewable electricity globally via combination on-site generation + PPAs
-78% of products carry third-party compostability certifications (BPI, EN 13432, OK Compost)
-92% of paper-based products use FSC-certified or recycled content
-100% of products comply with EU REACH, ” target=”_blank” rel=”noopener”>FDA food contact regulations
-Zero products contain PFAS (per- and polyfluoroalkyl substances) as of 2026
1.Closed-loop recycling: Production scrap (paper, fiber, plastic) sent to suppliers who re-integrate into feedstock, creating circular material flow
2.Programas de recogida: Piloting customer return programs in 3 markets (Netherlands, California, Japan) for post-consumer cup/container recycling
3.Industrial symbiosis: Partner with 8 local companies who use our waste streams as inputs (e.g., paper sludge → construction materials)
4.Design for circularity: 100% of new product designs evaluated via “Design for Environment” scorecard assessing recyclability, material health, carbon footprint
-Closed-loop cooling systems: Installed at Hangzhou and Rotterdam, reducing freshwater consumption 35% for equipment cooling
-Rainwater harvesting: 10,200 m³ captured annually (15% of total water use), used for non-potable applications (cleaning, irrigation)
-Process water recycling: Filtration systems treat and reuse water from pulp molding processes, diverting 14,800 m³/year from wastewater
-Low-flow fixtures: Retrofitted all facilities with sensor faucets, low-flow toilets, reducing potable water use 8%
-Drought response: Mexico facilities implement 20% voluntary water reduction during regional water stress periods
Wastewater management:-100% of wastewater treated to meet or exceed local discharge standards before release
-Zero discharge violations recorded in 2026 across all facilities
-Biochemical Oxygen Demand (BOD) reduced 28% vs 2020 via improved pre-treatment processes
 compostable food packaging products in sustainable manufacturing facili” style=”border-radius: 8px; box-shadow: 0 2px 8px rgba(0,0,0,0.08);”/>
-Total employees: 1,240 (full-time equivalent)
-Gender diversity: 42% women, 58% men (management: 38% women)
-Average tenure: 6.8 years
-Turnover rate: 12% (industry average: 18-22%)
Health and safety performance:-Training investment: $480k (avg $387/employee), 15% increase vs 2025
-Sustainability training: 100% of employees completed 8-hour “Sustainable Packaging Fundamentals” course
-Internal promotion rate: 68% of management roles filled internally
-Living wage commitment: 100% of employees paid ≥150% local living wage (vs minimum wage)
-Beneficios: Health insurance (100% employer-paid), retirement matching (6% contribution), parental leave (16 weeks paid)
1.Labor practices: No child labor, forced labor, discrimination; fair wages and working hours
2.Health & safety: Safe working conditions, protective equipment, emergency preparedness
3.Medioambiental: Waste management, emissions reduction, water conservation, chemical handling
4.Ethics: Anti-corruption, conflicts of interest, whistleblower protection
5.Materiales: Traceability, sustainable sourcing (FSC, RSPO), chemical restrictions (PFAS, heavy metals)
Supplier development programs:-Carbon reduction workshops: Hosted 8 workshops training 120 supplier representatives on emissions measurement and reduction strategies
-Financial support: Provided $250k in low-interest loans to 12 suppliers for sustainability investments (solar, energy efficiency)
-Joint innovation: Co-developed 4 new bio-based materials with raw material suppliers (PLA suppliers, pulp mills)
-Ellen MacArthur Foundation: Signed New Plastics Economy Global Commitment (2025), annual reporting on circular economy progress
-Ocean Conservancy: Partner in “Trash Free Seas” alliance, contribute technology and funding to reduce ocean plastic
-Coalición de Envases Sostenibles: Active member, participate in How2Recycle and How2Compost labeling programs
-World Wildlife Fund (WWF): Collaborate on FSC forest stewardship advocacy and sustainable fiber sourcing
-Sustainability Committee: Established 2024, 4 board members meet quarterly to review ESG performance, approve targets, allocate capital
-CEO accountability: Sustainability metrics (carbon reduction, renewable energy, waste diversion) comprise 20% of CEO performance evaluation
-Executive compensation: 15% of executive bonuses tied to achieving annual sustainability KPIs
Management accountability:-Chief Sustainability Officer (CSO): Reports directly to CEO, oversees environmental strategy, compliance, reporting
-Facility-level sustainability managers: Each manufacturing site has dedicated manager (1,240 employees total, 5 sustainability managers)
-Cross-functional teams: 12 employees across R&D, operations, procurement participate in “Green Innovation Task Force” meeting monthly
Policy frameworks:-Environmental Policy (updated 2026): Commits to science-based targets, circular economy, biodiversity protection
-Supplier Code of Conduct (updated 2025): Mandates ESG compliance, annual audits for suppliers >$100k annual spend
-Human Rights Policy (2024): Aligns with UN Guiding Principles, prohibits forced labor, child labor, discrimination
-Anti-Corruption Policy (2023): Zero-tolerance for bribery, conflicts of interest, whistleblower hotline
-Certificación BPI (USA compostability): 68% of products
-EN 13432 (EU compostability): 72% of products
-OK Compost (TÜV Austria): 58% of products
-FDA food contact compliance: 100% of products
-EU REACH compliance: 100% of products
Transparency and reporting standards:-GRI Standards (Global Reporting Initiative): Full compliance, annual sustainability report published
-SASB (Sustainability Accounting Standards Board): Materiality assessment and disclosure for Containers & Packaging sector
-TCFD (Task Force on Climate-related Financial Disclosures): Climate risk assessment and scenario analysis (2°C and 4°C pathways)
-CDP (Carbon Disclosure Project): Score A- (Leadership level) for Climate Change disclosure (2026)

-Scope 1+2: 85% absolute reduction by 2030 vs 2020 baseline (18,270 → 2,740 tCO₂e)
-Scope 3: 50% reduction in value chain emissions intensity (per tonne product) by 2030
-Alineación: 1.5°C Paris Agreement pathway (limiting global warming to 1.5°C)
1.Monomaterial design: Eliminate multi-layer materials that can’t be recycled/composted
2.Chemical simplification: Remove PFAS, heavy metals, problematic adhesives
3.Modular design: Create cups/containers with separable components (e.g., detachable lids for easier sorting)
4.Standardization: Reduce SKU complexity, enabling economies of scale in recycling/composting
1.Heat-resistant compostable cups for hot beverages (addressed via PLA-PBAT launch)
2.Transparent reporting on product carbon footprints (implementing QR codes linking to LCA data)
3.Bulk discounts for high-volume sustainable orders (introduced tiered pricing 2027)
4.Customization options for compostable products (expanding digital printing for low-MOQ custom branding)
-Green Teams: Voluntary employee groups at each facility identify waste reduction, energy savings opportunities (42 implemented ideas in 2026, saving $68k)
-Commute programs: 35% of employees use sustainable commute options (bike, public transit, carpool) via subsidies and incentives
-“Innovation Fridays”: Monthly sessions where employees pitch sustainability ideas, top 3 receive $5k development budgets
The Papacko Sustainability Report 2026 is a comprehensive annual disclosure detailing our environmental, social, and governance (ESG) performance across operations, products, supply chain, and community engagement. The report transparently shares data on carbon emissions (42% reduction vs 2020), renewable energy adoption (68%, 100% in Europe), sustainable materials (78% compostable/recyclable portfolio), waste diversion (89%, three zero-waste facilities), water conservation (2.8 m³/tonne, -35% vs 2020), and supplier ESG compliance (72% verified). Verified by third-party EcoVadis (Platinum rating — 82/100), the report demonstrates accountability to stakeholders and progress toward 2030 carbon neutrality and 95% sustainable product targets.
Papacko’s 2026 sustainability highlights include: (1) 42% carbon emission reduction (Scope 1+2) vs 2020 baseline, exceeding interim 35% target; (2) 78% of product portfolio certified compostable or recyclable, up from 61% in 2025; (3) Zero waste to landfill achieved at Hangzhou, Rotterdam, and Guadalajara facilities (99.4-99.8% diversion); (4) 100% renewable electricity in European operations via solar and wind PPAs; (5) EcoVadis Platinum rating (82/100, top 1% of packaging manufacturers); (6) 72% of suppliers verified ESG-compliant through third-party audits; (7) $1.2M invested in environmental education and compost infrastructure grants.
Papacko measures greenhouse gas emissions across Scopes 1, 2, and 3 following GHG Protocol standards, verified by third-party auditors. 2026 total emissions: 21,650 tCO₂e (Scope 1: 3,850; Scope 2: 8,600; Scope 3: 9,200). Carbon reduction strategies include: renewable energy procurement (68% renewable electricity, saving 8,200 tCO₂e annually), energy efficiency investments (LED lighting, HVAC optimization, heat recovery reducing energy 12-18%), fleet electrification (35% electric vehicles), material lightweighting (8% weight reduction), and supplier engagement programs. Carbon intensity improved 42% to 0.42 tCO₂e/tonne product. 2030 target: net zero via 85% absolute reduction + 15% high-quality offsets, validated by Science Based Targets initiative (SBTi).
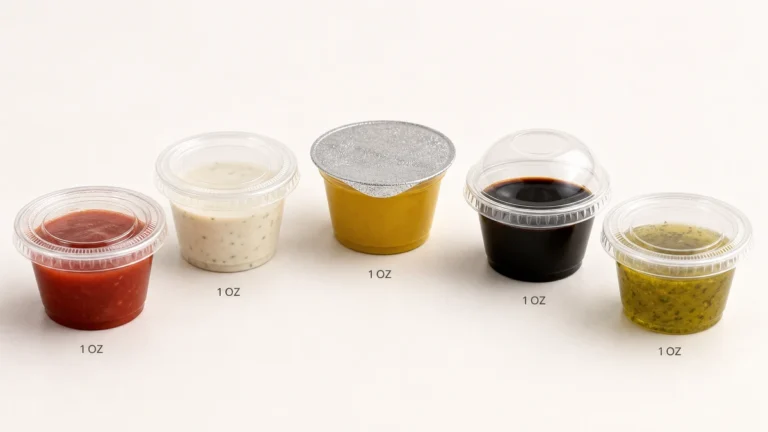
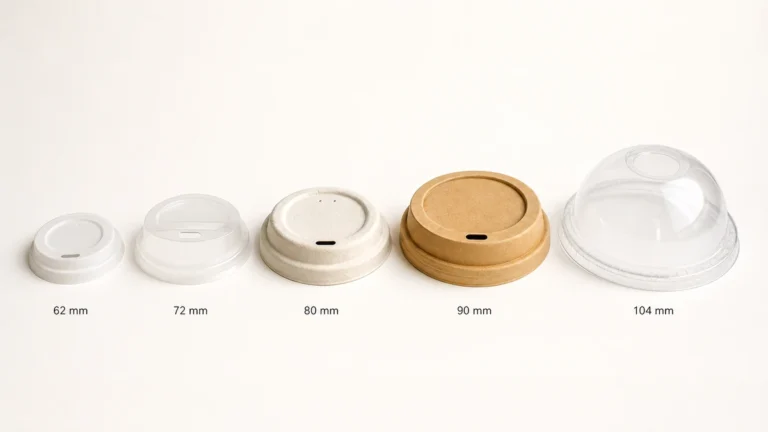
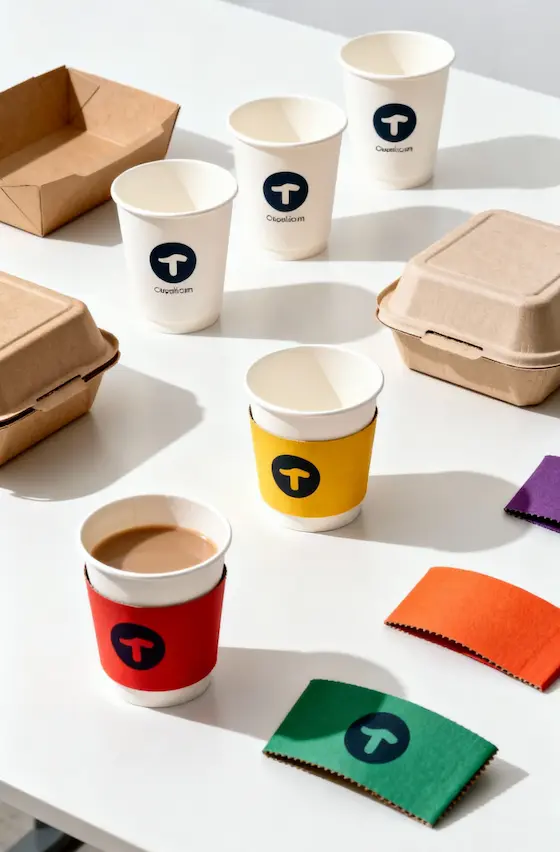
78% of Papacko’s product portfolio (497 SKUs) is certified compostable or recyclable as of 2026, up from 61% in 2025 and 30% in 2020. Breakdown by category: “>paper cups (68% compostable, 22% recyclable), “>food containers (82% compostable, 12% recyclable), lids/accessories (71% compostable, 18% recyclable). Only 4% of products remain conventional plastics (being phased out by 2028). Compostable products carry BPI (” target=”_blank” rel=”noopener”>ASTM D6400), EN 13432, or OK Compost certifications guaranteeing biodegradation within 180 days at industrial facilities. 92% of paper products use FSC-certified or recycled content. 2030 target: 95% sustainable materials portfolio.
Papacko’s Supplier Code of Conduct mandates ESG compliance across labor practices (no child/forced labor, fair wages), health/safety, environmental management, ethics (anti-corruption), and materials (sustainable sourcing, chemical restrictions). 72% of suppliers by spend underwent third-party audits in 2026 (up from 44% in 2025), with 89% meeting standards. Non-compliant suppliers receive corrective action plans; persistent violators are terminated. Supplier development programs include carbon reduction workshops (120 supplier representatives trained), $250k in sustainability investment loans, and joint innovation on bio-based materials. 52% of suppliers now have carbon reduction targets. 2030 goal: 100% supplier audit coverage and compliance, with all suppliers having science-based carbon targets.
Papacko’s 2030 sustainability targets include: (1) Carbon neutrality (net zero Scope 1+2 emissions via 85% reduction + 15% offsets, SBTi-validated 1.5°C pathway); (2) 100% renewable electricity globally via on-site solar and wind PPAs; (3) 95% compostable/recyclable product portfolio, phasing out conventional plastics; (4) Zero waste to landfill at all facilities (100% diversion rate); (5) 75% recycled content across products; (6) 2.0 m³/tonne water intensity (29% reduction vs 2026); (7) 100% supplier ESG verification and compliance; (8) B Corp Certification; (9) Biodiversity net positive (restore 2× forest harvested); (10) Product-as-a-service representing 5% revenue (reusable container systems).
Papacko publishes comprehensive sustainability reports annually on papacko.com/sustainability — following GRI (Global Reporting Initiative) Standards, SASB (Sustainability Accounting Standards Board) frameworks, and TCFD (climate risk) guidelines. Reports include detailed carbon footprint data (Scope 1/2/3), renewable energy breakdowns, product certifications, waste diversion metrics, water consumption, supplier audits, employee safety, and community investments. Stakeholders can request specific data via sustainability@papacko.com. Third-party verifications include EcoVadis (Platinum, 82/100), ” target=”_blank” rel=”noopener”>ISO 14001/45001 certifications, CDP Climate disclosure (A- Leadership), and SBTi carbon targets. Product-level lifecycle assessment (LCA) data available via QR codes on packaging (launching 2027) — showing carbon footprint and disposal instructions.
Papacko’s 2026 sustainability performance demonstrates that environmental stewardship and business growth are mutually reinforcing, not competing, priorities. Our 42% carbon reduction, 78% sustainable product portfolio, and three zero-waste facilities prove that the food packaging industry can profitably transition toward circularity, renewable materials, and net-zero emissions. These achievements position Papacko as an ESG leader, earning EcoVadis Platinum recognition and customer trust in 12 global markets.
Principales conclusiones:1.Carbon leadership: 42% Scope 1+2 reduction vs 2020, exceeding interim targets, on track for 2030 carbon neutrality via renewable energy, efficiency, and supplier engagement
2.Product transformation: 78% compostable/recyclable portfolio (vs 30% in 2020), launching heat-resistant PLA and carbon-negative mushroom trays expanding sustainable material applications
3.Circular economy progress: Three facilities achieved zero waste, 89% overall diversion, closed-loop recycling systems, and take-back pilots in 3 markets
4.Renewable energy acceleration: 68% renewable electricity (100% in Europe), on-site solar installations, and wind PPAs reducing emissions 8,200 tCO₂e annually
5.Stakeholder accountability: EcoVadis Platinum (top 1%), SBTi-validated targets, GRI/SASB/TCFD reporting, 72% supplier ESG verification
6.2030 ambitious targets: Net zero emissions, 95% sustainable products, 100% renewable energy, zero waste all facilities, B Corp certification, biodiversity net positive
7.Transparency commitment: Annual reporting, third-party verification, stakeholder engagement, and product-level LCA data (launching 2027 via QR codes)
We invite customers, investors, employees, and communities to partner with Papacko in building a sustainable food packaging future. Together, we can prove that profitability and planetary health are not trade-offs—they are the foundation of enduring business success.
-“>Acerca de Papacko
-“>Soluciones de embalaje sostenible
-“>Compostable Product Certifications
-“>Corporate Social Responsibility
Papacko delivers certified compostable and recyclable food packaging to restaurants, caterers, food delivery platforms, and institutional buyers committed to reducing environmental impact. Our sustainability team provides carbon footprint assessments, compostability certification guidance (BPI, EN 13432), waste infrastructure partnerships, and customized packaging solutions aligned with your ESG goals.
Póngase en contacto:-“>Download Full 2026 Sustainability Report
Última actualización: Mayo 2026