هل أنت مستعد لإنشاء أكواب ورقية أو عبوات ورقية تحمل علامتك التجارية الخاصة بك؟
أخبرنا بمتطلباتك - الحجم والطلاء والطباعة والوجهة - وسيقوم فريقنا بإعداد عرض أسعار مفصل في غضون 24 ساعة.
آخر تحديث: نوفمبر 2025
وقت القراءة: 8-10 دقائق
المؤلف: فريق محتوى باباكو
يشهد سوق التغليف البيئي نموًا غير مسبوق. وصل الطلب العالمي على حلول التغليف المستدام إلى $267 مليار دولار أمريكي في عام 2024، وتشير التوقعات إلى أنه سيصل إلى $413 مليار دولار أمريكي بحلول عام 2030 - وهو معدل نمو سنوي مركب (CAGR) يبلغ 7.51T3T. ولكن وراء هذه الأرقام تكمن تحولات أساسية في اللوائح التنظيمية وسلوك المستهلكين وابتكار المواد التي تعيد تشكيل صناعة تغليف المواد الغذائية بأكملها.
يحلل هذا الدليل المستند إلى البيانات القوى الدافعة لاعتماد التغليف البيئي، ويحلل ديناميكيات السوق الإقليمية، ويوفر رؤى قابلة للتنفيذ للشركات التي تخوض هذا التحول.
ستكتشف في هذا المقال ما يلي:
-حجم السوق وتوقعات النمو عبر المناطق وفئات المواد
-الدوافع التنظيمية تشكيل متطلبات التعبئة والتغليف في الاتحاد الأوروبي وأمريكا الشمالية وآسيا
-اتجاهات سلوك المستهلك التأثير على قرارات الشراء
-الابتكار في المواد والتقنيات الناشئة
💡 الوجبات السريعة: سوق التغليف البيئي لا ينمو فقط - بل يتسارع نموه.
تكتسب الشركات التي تستثمر في التغليف المستدام الآن ميزة تنافسية وامتثالًا تنظيميًا ووصولاً إلى شرائح المستهلكين المتميزين المستعدين لدفع 10-15% أكثر مقابل المنتجات الصديقة للبيئة.
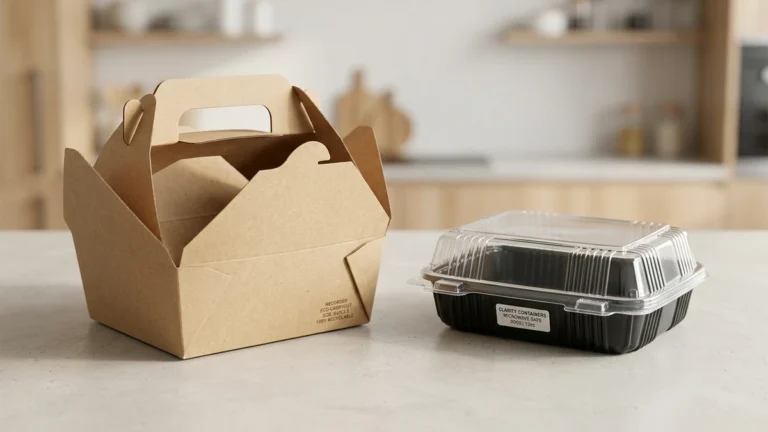
يشمل سوق التغليف البيئي جميع مواد التعبئة والتغليف والحلول المصممة لتقليل الأثر البيئي من خلال:
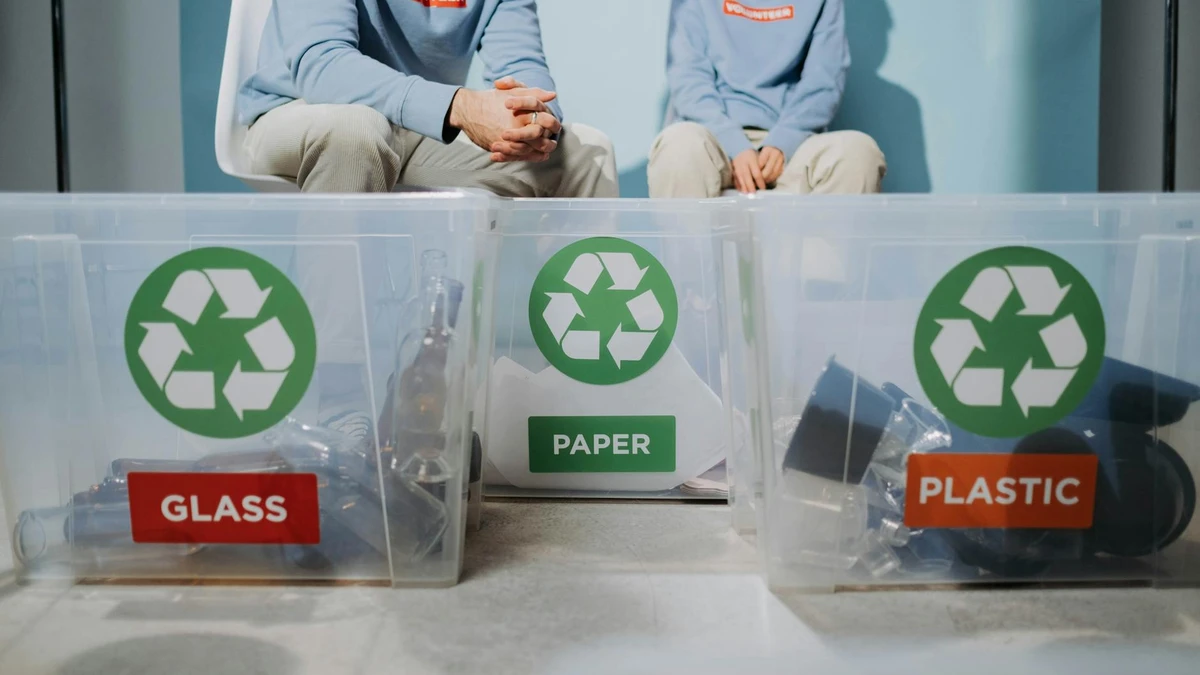
-المواد القابلة لإعادة التدوير (الورق والورق المقوى وبعض المواد البلاستيكية)
-الخيارات القابلة للتسميد/التحلل الحيوي (PLA، الألياف المصبوبة، تفل قصب السكر)
-الأنظمة القابلة لإعادة الاستخدام (خطط إرجاع الودائع، العبوات القابلة لإعادة التعبئة)
-تقليل استخدام المواد (خفة الوزن والتصميم البسيط)
قطاعات السوق:
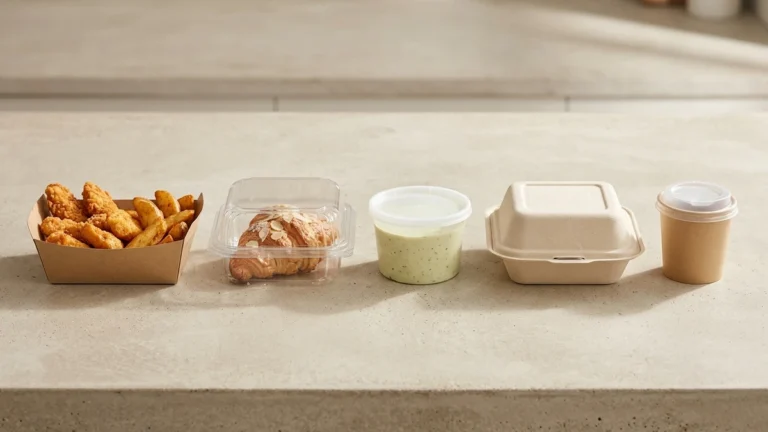
التطبيقات الرئيسية:
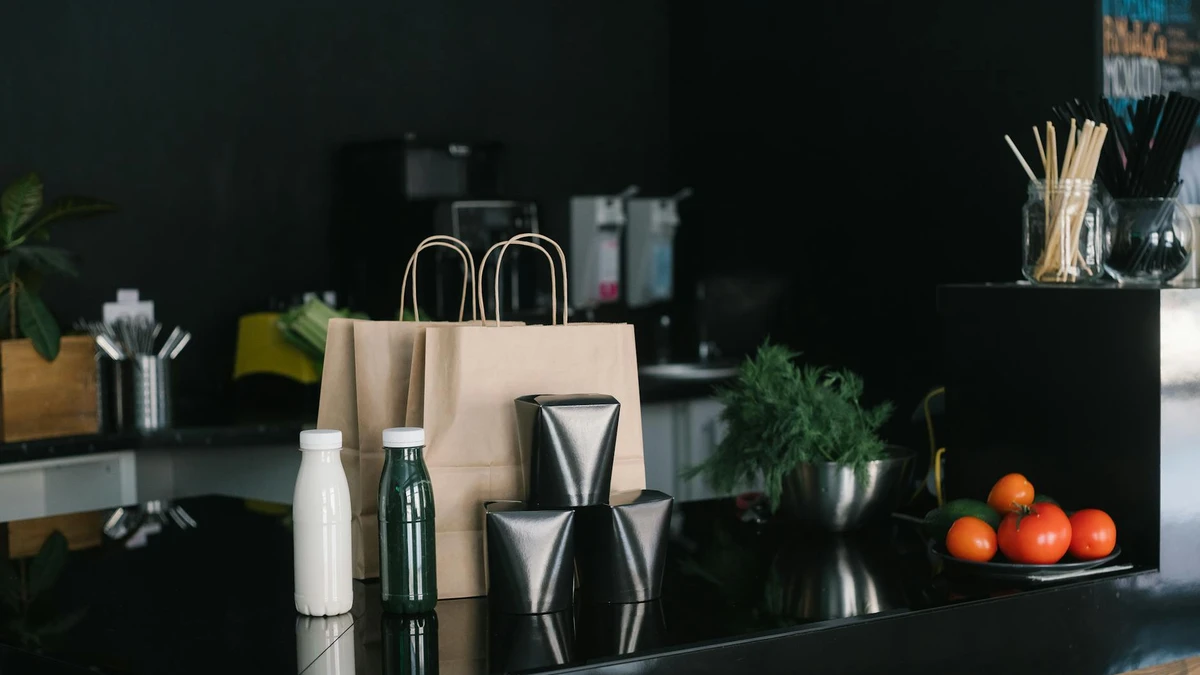
-خدمات الطعام (الأكواب والأوعية وحاويات الوجبات الجاهزة): 42% من سوق العبوات البيئية
-تغليف المواد الغذائية بالتجزئة (منتجات طازجة، مخبوزات) 28%
-شحن التجارة الإلكترونية: 15%
-العناية الشخصية/مستحضرات التجميل: 10%
-أخرى: 5%
🎯 رؤى الصناعة: تهيمن الخدمات الغذائية على الطلب على التغليف الصديق للبيئة لأن الضغط التنظيمي ورؤية المستهلكين هي الأعلى في هذا القطاع.
تواجه مطاعم الخدمة السريعة مخاطر فورية للعلامة التجارية بسبب التغليف غير المستدام.
أهم أسواق النمو (2024-2030):
1.الهند: 11.2% CAGR 11.2% (مدفوعًا بحظر البلاستيك أحادي الاستخدام لعام 2022)
2.إندونيسيا: 10.8% CAGR (التزامات الاستدامة في رابطة أمم جنوب شرق آسيا)
3.ألمانيا:: 9.5% CAGR (الامتثال لقانون التعبئة والتغليف، أنظمة الإيداع)
4.المملكة المتحدة:: 9.1% CAGR (ضريبة العبوات البلاستيكية)
5.الولايات المتحدة الأمريكية:: 7.9% CAGR 7.91 (التباين على مستوى الولاية، كاليفورنيا في الصدارة)
نمو التغليف المستند إلى الورق:
-حجم السوق 2024: $101 مليار
-توقعات عام 2030: $148 مليار
-معدل النمو السنوي المركب: 6.8%
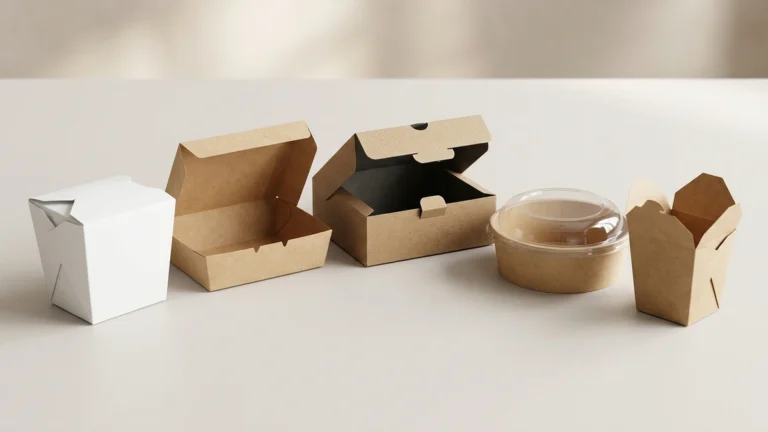
-المنتجات الرئيسية: أكواب ورقية, ، علب الطعام، وأكياس التسوق، وحاويات الألياف المقولبة
لماذا يؤدي الورق: بنية تحتية راسخة لإعادة التدوير، وإلمام المستهلك، وتنافسية التكلفة مع البلاستيك التقليدي في العديد من التطبيقات.
نمو البلاستيك الحيوي:
-حجم السوق 2024: $32 مليار
-توقعات عام 2030: $64 مليار
-معدل النمو السنوي المركب: 12.3%
-المنتجات الرئيسية: أكواب مغطاة بجلاستيك PLA، وأدوات مائدة قابلة للتسميد، وأغشية حيوية
التحدي: يتطلب مرافق سماد صناعي غير متوفرة بعد في العديد من الأسواق. ويظل تلوث مجاري إعادة التدوير مصدر قلق.
توجيهات الاتحاد الأوروبي بشأن المواد البلاستيكية أحادية الاستخدام (2021):
-يحظر الأطباق البلاستيكية، وأدوات المائدة، وأدوات المائدة، والماصات، وأدوات التحريك، وعصي البالونات
-إلزامية جمع زجاجات PET 90% بحلول عام 2029
-تتطلب مسؤولية المنتج الممتدة (EPR) لجميع العبوات
التأثير على سوق التغليف البيئي:
ضريبة العبوات البلاستيكية في المملكة المتحدة (2022):
-ضريبة 200 جنيه إسترليني/طن على العبوات البلاستيكية ذات المحتوى المعاد تدويره <30%
-يقود إلى التحول إلى البدائل الورقية أو محتوى البلاستيك المعاد تدويره بنسبة أعلى
-النتيجة: 24% زيادة في الطلب على الكرافت المعاد تدويره حاويات الطعام
الولايات المتحدة (التباين من ولاية إلى أخرى):
كندا:
-حظر فيدرالي على المواد البلاستيكية أحادية الاستخدام (2022-2025)
-يؤثر على أكياس الخروج وأدوات المائدة والماصات وعصي التحريك وحاويات الوجبات الجاهزة
-تأثير السوق: 19% النمو السنوي في عبوات الخدمات الغذائية القابلة للتحويل إلى سماد
الصين:
-2020: حظر الأكياس البلاستيكية غير القابلة للتحلل في المدن الكبرى
-2022: تمتد إلى جميع المدن والمقاطعات
-هدف 2025: 40% تخفيض استهلاك البلاستيك المستخدم مرة واحدة
-تأثير السوق: $12 مليار دولار أمريكي في مجال الورق والتعبئة والتغليف القائم على أساس حيوي
اليابان:
-قانون تداول الموارد البلاستيكية (2022)
-رسوم إلزامية على الأكياس البلاستيكية وأدوات المائدة البلاستيكية
-الهدف: معدل إعادة تدوير 60% للعبوات البلاستيكية بحلول عام 2030
-النتيجة: 17% زيادة في عبوات الوجبات الجاهزة الورقية
الهند:
-حظر عام 2022 على المواد البلاستيكية المحددة ذات الاستخدام الواحد
-متطلبات السماكة للأكياس البلاستيكية المسموح بها
-استجابة السوق: طفرة في الطلب على أوراق الموز وتفل قصب السكر والبدائل الورقية (+35% نمو 2022-2024)
سؤال: “هل ستختار منتجًا ذا عبوات صديقة للبيئة على العبوات التقليدية إذا كان السعر هو نفسه؟”
الاستعداد المتميز:
الرؤى الرئيسية: “البقعة الحلوة” هي 5-10% علاوة. أما ما بعد 15%، فلا يرغب في الدفع إلا من يتبنون هذه العلاوة في وقت مبكر من عمرهم.
خدمات الطعام:
-78% من المستهلكين يتوقعون أن تستخدم المقاهي والمطاعم عبوات قابلة للتسميد أو قابلة لإعادة التدوير
-62% ستعمل بنشاط على تجنب الشركات التي تستخدم حاويات رغوة البوليسترين
-54% تصوير ومشاركة العبوات المستدامة المبهجة من الناحية الجمالية على وسائل التواصل الاجتماعي
التجارة الإلكترونية:
-71% يفضل الحد الأدنى من التغليف بمواد معاد تدويرها
-49% سيختار بائع تجزئة على آخر بناءً على التغليف المستدام
-38% توقفوا عن الشراء من إحدى العلامات التجارية بسبب الإفراط في نفايات التغليف
مجالات التركيز على الابتكار الورقي:
1.الطلاءات العازلة: الطلاءات ذات الأساس المائي والمعدني التي تحل محل PLA/PE لتحسين قابلية إعادة التدوير
2.ألياف مصبوبة: تشكيل ثلاثي الأبعاد للأشكال المعقدة (الأوعية والصدفيات) بأقل قدر من المواد
3.النانوسليلوز النانوي: أغشية رقيقة للغاية وقوية ذات خصائص حاجز الأكسجين/الرطوبة
استثمارات الشركات الكبرى (2023-2024):
-نستله: التزام $2.1 مليار دولار للبحث والتطوير في مجال التغليف المستدام بحلول عام 2025
-يونيليفر: الانتقال إلى عبوات 100% القابلة لإعادة الاستخدام أو القابلة لإعادة التدوير أو القابلة للتسميد بحلول عام 2025
-ماكدونالدز: $ 1.4 مليار دولار مستثمرة في البنية التحتية للتغليف القائمة على الألياف
-ستاربكس: القضاء على القش البلاستيكي على مستوى العالم (استبدال 1 مليار قشة/سنة)
نشاط الاندماج والاستحواذ:
-استحواذ شركات التعبئة والتغليف الورقية على 37 شركة ناشئة للمواد الحيوية (2023)
-متوسط علاوة الاستحواذ: 42% أعلى من تقييم السوق
-مجالات التركيز: بدائل طلاء PLA، وتكنولوجيا الألياف المصبوبة، ومصادر المحتوى المعاد تدويره
توفر مرفق التسميد:
المشكلة: تتطلب الأكواب المغطاة بجلاستيك PLA والحاويات القابلة للتحويل إلى سماد صناعي (55-60 درجة مئوية لمدة تزيد عن 12 أسبوعًا). وبدون البنية التحتية، فإنها تلوث مجاري إعادة التدوير أو ينتهي بها المطاف في مدافن النفايات حيث لا تتحلل بيولوجيًا.
مقارنة الأسعار (لكل وحدة، التسعير بالجملة):
تحليل نقطة التعادل:
-عمليات ذات حجم كبير (> 50,000 وحدة/شهر): قسط يضيق إلى 20-40% مع توريد الشركة المصنعة مباشرة
-الشركات الصغيرة (أقل من 5000 وحدة/شهر): قسط الوجه 80-150% بسبب قيود موك وعلامات التوزيع
سوء الفهم الشائع:
1.“قابل للتحلل الحيوي = آمن بيئيًا”: غير صحيح إذا انتهى المطاف بالأشياء في مدافن النفايات بدون أكسجين/ميكروبات
2.“جميع العبوات الورقية قابلة لإعادة التدوير”: غالبًا ما تلوث الأوراق المغلفة الزائفة مجاري إعادة التدوير
3.“قابل للتسميد يعني قابل للتسميد المنزلي”: تتطلب معظمها منشآت صناعية في درجات حرارة محددة
استجابة الصناعة: معايير أكثر وضوحًا لوضع العلامات، وعلامات اعتماد (BPI، TÜV النمسا، شعار Seedling)، وحملات تثقيف المستهلكين.
تقييم وضعك في السوق:
### ROI Beyond Cost
الفوائد الملموسة:
-الامتثال التنظيمي: تجنب الغرامات ($P5,000-1TP4,000TP4,000/مخالفة في بعض الولايات القضائية)
-الوصول إلى الأسواق: مطلوبة للعقود مع كبار تجار التجزئة/سلاسل التجزئة الكبرى
-إدارة النفايات: الوفورات المحتملة في تكاليف التخلص من النفايات في أنظمة الدفع حسب الوزن
الفوائد غير الملموسة:
-حقوق ملكية العلامة التجارية: 37% من جيل الألفية على استعداد لتبديل العلامات التجارية من أجل التغليف المستدام
-وسائل التواصل الاجتماعي: 54% مشاركة أعلى في المنشورات التي تعرض التغليف البيئي
-الروح المعنوية للموظفين:: 68% من العمال يفضلون أصحاب العمل الذين لديهم التزامات بالاستدامة
❌ الخطأ #1: على افتراض أن الادعاءات “الصديقة للبيئة” لا تتطلب إثباتًا
✅ النهج الصحيح: الحصول على شهادات من طرف ثالث (FSC، BPI، TÜV) والإبلاغ بوضوح عن القيود (على سبيل المثال، “قابل للتسميد الصناعي”)
❌ الخطأ #2: التحول إلى البلاستيك الحيوي دون التحقق من البنية التحتية المحلية للسماد العضوي
✅ النهج الصحيح: مراجعة قدرات إدارة النفايات في منطقتك واختيار المواد التي تتماشى مع أنظمة نهاية العمر المتاحة
❌ الخطأ #3: التقليل من تقدير المهل الزمنية لسلسلة التوريد للتغليف البيئي
✅ النهج الصحيح: خطة من 8 إلى 12 أسبوعًا للتغليف الورقي/البيولوجي المخصص مقابل 2-4 أسابيع للتغليف البلاستيكي التقليدي
❌ الخطأ #4: تجاهل التأثير البيئي الكلي لدورة الحياة
✅ النهج الصحيح: إجراء تقييم دورة الحياة (تقييم دورة الحياة) للتحقق من أن البديل البيئي يقلل بالفعل من التأثير الصافي (يتطلب بعضها المزيد من الطاقة/المياه في الإنتاج)
يشمل سوق التغليف الصديق للبيئة جميع مواد التعبئة والتغليف المصممة لتقليل الأثر البيئي من خلال قابلية إعادة التدوير أو التسميد أو إعادة الاستخدام أو تقليل استخدام المواد. وقد بلغت قيمتها $267 مليار دولار أمريكي على مستوى العالم في عام 2024، ومن المتوقع أن تنمو إلى $413 مليار دولار أمريكي بحلول عام 2030.
ينمو سوق التعبئة والتغليف البيئي العالمي بمعدل نمو سنوي مركب يبلغ 7.51 تيرابايت 3 طن سنوي مركب (CAGR) في الفترة من 2024-2030. ينمو قطاع البلاستيك الحيوي بوتيرة أسرع (12.31 تيرابايت 3 تيرابايت 3 تيرابايت معدل نمو سنوي مركب) بينما ينخفض البلاستيك التقليدي (-2.11 تيرابايت 3 تيرابايت معدل نمو سنوي مركب).
تشمل الدوافع الرئيسية ما يلي: (1) التفويضات التنظيمية (توجيه الاتحاد الأوروبي للبلاستيك أحادي الاستخدام، والحظر على مستوى الدولة في الولايات المتحدة/كندا)، (2) طلب المستهلكين (68% يفضلون التغليف المستدام بأسعار مماثلة)، و(3) التزامات الشركات بالبيئة والصحة والسلامة البيئية من العلامات التجارية الكبرى.
نعم. تزيد تكلفة العبوات الصديقة للبيئة عادةً بمقدار 30-1501 تيرابايت 3 تيرابايت عن مثيلاتها من البلاستيك التقليدي، اعتمادًا على المواد والحجم. يمكن للمشترين ذوي الأحجام الكبيرة (أكثر من 50,000 وحدة/شهر) تضييق هذه العلاوة إلى 20-401 تيرابايت 3 تيرابايت 3 تيرابايت من خلال علاقات مباشرة مع الشركة المصنعة.
أوروبا تتصدر أوروبا بحجم سوق يبلغ $98 مليار دولار أمريكي ومعدل نمو سنوي مركب يبلغ 8.2%، مدفوعًا باللوائح التنظيمية الشاملة للاتحاد الأوروبي. تُظهر منطقة آسيا والمحيط الهادئ نموًا قويًا (7.91 تيرابايت 3 تيرابايت معدل نمو سنوي مركب) مدفوعًا بسياسات النفايات البلاستيكية في الصين وحظر الهند للاستخدام الواحد.
التحديات الرئيسية: (1) عدم كفاية البنية التحتية لتحويل المواد البلاستيكية الحيوية إلى سماد، (2) أقساط التكلفة التي تحد من اعتماد الشركات الصغيرة، (3) ارتباك المستهلكين بشأن طرق التخلص، (4) ثغرات الأداء في مقاومة الرطوبة ومدة الصلاحية لبعض المواد.
لا، سيستحوذ التغليف الصديق للبيئة على ما يقدر بـ 701 تيرابايت 3 تيرابايت من عبوات خدمات الأغذية و551 تيرابايت 3 تيرابايت من عبوات الأغذية بالتجزئة بحلول عام 2030، ولكن سيستمر البلاستيك التقليدي في التطبيقات التي تتطلب متانة قصوى أو خصائص حاجز أو تحسين التكلفة.
يعكس مسار نمو سوق التغليف الصديق للبيئة إعادة هيكلة أساسية لصناعة التغليف العالمية. فقد اتحد الزخم التنظيمي وتفضيلات المستهلكين والتزامات الشركات بالاستدامة لخلق زخم لا رجعة فيه نحو البدائل المستدامة.
الوجبات السريعة الرئيسية:
1.سيزداد حجم السوق 55% من عام 2024 ($267B) إلى 2030 ($413B)، مع نمو البلاستيك الحيوي الأسرع (معدل نمو سنوي مركب 12.3%)
2.الضغط التنظيمي يدفع إلى التبني أكثر من استعداد المستهلكين للدفع، خاصة في دول الاتحاد الأوروبي والولايات المتحدة الأمريكية التقدمية
3.تهيمن العبوات الورقية التحولات الحالية بسبب البنية التحتية القائمة لإعادة التدوير والقدرة التنافسية من حيث التكلفة
4.ثغرات البنية التحتية تحد من اللدائن الحيوية: فقط 18-32% من السكان لديهم إمكانية الوصول إلى السماد الصناعي اللازم لمواد PLA
5.أقساط الأسعار تتقلص: يدفع المشترون بالجملة الآن 20-40% أكثر مقابل 80-150% لصغار المشترين
تكتسب الشركات التي تنتقل بشكل استباقي إلى التعبئة والتغليف الصديق للبيئة الامتثال التنظيمي وحقوق ملكية العلامة التجارية والوصول إلى قطاعات المستهلكين المتنامية. أما الشركات التي تتأخر في ذلك فتواجه تكاليف متزايدة بسبب اللوائح التنظيمية والقيود المفروضة على الوصول إلى الأسواق ومخاطر سمعة العلامة التجارية.
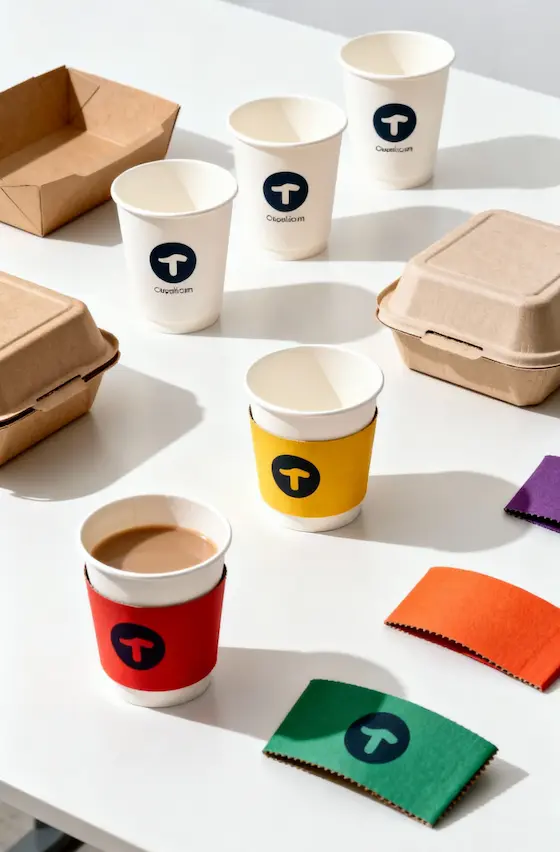
تُصنِّع Papacko مجموعة كاملة من حلول تغليف المواد الغذائية المستدامة بما في ذلك الأكواب الورقية وحاويات الألياف المقولبة والملحقات القابلة للتسميد. تفي منتجاتنا بالمعايير التنظيمية للاتحاد الأوروبي وأمريكا الشمالية وهي معتمدة لقابلية إعادة التدوير أو التسميد الصناعي.
Market-growth pages are most useful when they connect numbers to operational choices: certification, legal pressure, and which sustainability routes are commercially actionable right now. These pages help bridge trend data with execution.
تواصل معنا
آخر تحديث: نوفمبر 2025