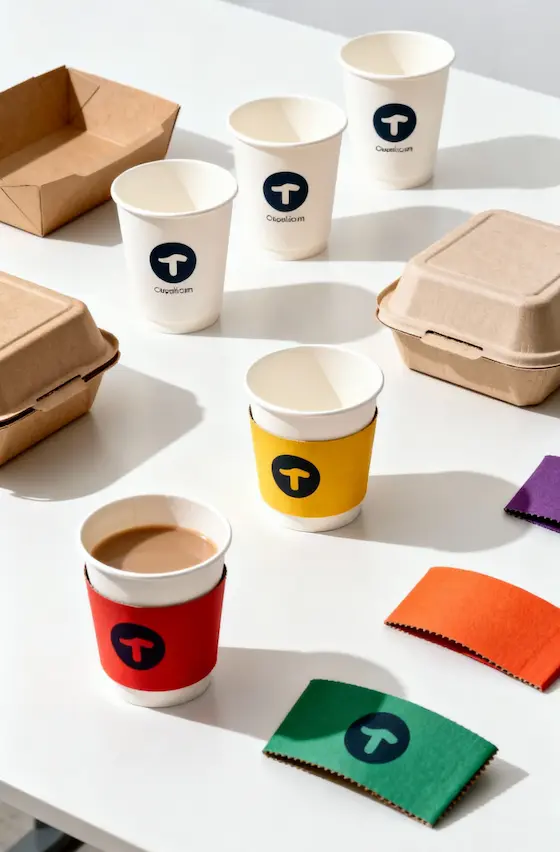
هل أنت مستعد لإنشاء أكواب ورقية أو عبوات ورقية تحمل علامتك التجارية الخاصة بك؟
أخبرنا بمتطلباتك - الحجم والطلاء والطباعة والوجهة - وسيقوم فريقنا بإعداد عرض أسعار مفصل في غضون 24 ساعة.
آخر تحديث: نوفمبر 2025
وقت القراءة: 8-10 دقائق
المؤلف: فريق محتوى باباكو
العالمية أكواب ورقية نقل سوق الجملة $18.2 مليار دولار في عام 2024، مع تصنيع 420 مليار وحدة وتوزيعها عبر قنوات الخدمات الغذائية والتجزئة والقنوات المؤسسية. تقف وراء الذروة الصباحية لكل مقهى في كل مقهى ورعاية المرضى في كل مستشفى سلسلة توريد معقدة توازن بين شراء المواد الخام والقدرة التصنيعية والشحن بالحاويات والتسليم في الوقت المناسب. إن فهم هذه الديناميكيات يفصل بين المشتريات المربحة والاضطرابات المكلفة.
يفحص هذا الدليل النظام البيئي لبيع الأكواب الورقية بالجملة بدءًا من الشركة المصنعة إلى المشتري النهائي، ويحلل هياكل التسعير، ومخاطر سلسلة التوريد، وممارسات التوريد الاستراتيجية للموزعين، وكبار مشغلي الخدمات الغذائية، وشركات التصدير/الاستيراد.
في هذه المقالة، ستتعلم ما يلي:
-هيكل السوق العالمي ومراكز التصنيع الرئيسية (الصين، والهند، وتركيا)
-ديناميكيات التسعير من المواد الخام إلى تكاليف الإنزال
-نقاط ضعف سلسلة التوريد واستراتيجيات التخفيف من المخاطر
-لوجستيات التصدير/الاستيراد بما في ذلك موكس، والمهل الزمنية والتوثيق
💡 الوجبات السريعة: تختلف أسعار بيع الأكواب الورقية بالجملة 300-500% على مستوى العالم بناءً على إمكانية الوصول إلى المواد الخام وتكاليف العمالة والخدمات اللوجستية.
يكلف الكوب المغطى بـ 12 أوقية من البولي إيثيلين البولي إيثيلين $0.025-0.035 فوب الصين مقابل.
هبط $0.08-0.12 في أمريكا الشمالية.
يحصل المشترون الإستراتيجيون على مصدر مباشر من الشركات المصنعة بفترات توريد تتراوح بين 60-90 يومًا، بينما يدفع المشترون الإستراتيجيون من خلال الموزعين أقساط 40-80%.
يتألف سوق بيع الأكواب الورقية بالجملة من معاملات تجارية بين الشركات المصنعة والموزعين والمستوردين والمستخدمين النهائيين على نطاق واسع الذين يشترون الأكواب بكميات تتجاوز 10,000 وحدة لكل طلب. تشمل قطاعات السوق الرئيسية ما يلي:
فئات المشترين:
فئات المنتجات:
-أكواب أحادية الجدار (4-24 أونصة): 68% من الحجم
-أكواب مزدوجة الجدار/كعوب مزدوجة: 18% من الحجم
-التخصص (طباعة مخصصة، مواد ممتازة): 14% من الحجم
🎯 رؤى الصناعة:: يتدفق 72% من حجم الأكواب الورقية بالجملة من خلال الموزعين الذين يجمعون الطلبات من المشترين الصغار إلى المتوسطين.
28% فقط هي 28% من المصنع إلى المستخدم النهائي، وعادةً ما تكون سلاسل كبيرة ذات مشتريات مركزية (ستاربكس، ماكدونالدز، سوديكسو).
الصين (45% من السعة العالمية):
-حجم الإنتاج: ~حوالي 190 مليار كوب سنويًا
-ميزة التكلفة: $0.020-0.030 فوب للأكواب القياسية المغلفة بالبولي إيثيلين سعة 12 أونصة
-المناطق الرئيسية: تشجيانغ (ونزهو، تايتشو)، قوانغدونغ (دونغقوان، شينزين)، جيانغسو
-نقاط القوة: نطاق واسع، سلسلة توريد متكاملة (مصانع الورق والطلاء والطباعة)
-نقاط الضعف: تباين الجودة، مخاوف تتعلق بحماية الملكية الفكرية، الشحن خلال 20-35 يومًا إلى الولايات المتحدة/الاتحاد الأوروبي
الهند (12% من السعة العالمية):
-حجم الإنتاج: ~حوالي 50 مليار كوب سنويًا
-التكلفة: $0.025-0.035 فوب (تكاليف عمالة + طاقة أعلى قليلاً)
-التركيز على التصدير: الشرق الأوسط وأفريقيا وجنوب شرق آسيا (ميزة جغرافية)
-نقاط القوة: اللغة الإنجليزية، والاستثمار في القدرات المتزايدة
-نقاط الضعف: اختناقات البنية التحتية وعدم اتساق إمدادات الطاقة
تركيا (8% من السعة العالمية):
-حجم الإنتاج: ~حوالي 34 مليار كوب سنويًا
-التكلفة: $0.035-0.045 فوب $0.035-0.045 فوب
-الميزة الجغرافية:: الشحن خلال 7-12 يوماً إلى الاتحاد الأوروبي، والوصول إلى الشرق الأوسط/شمال أفريقيا
-نقاط القوة: اتساق الجودة، والمواءمة التنظيمية للاتحاد الأوروبي
-نقاط الضعف: النطاق المحدود مقابل المنافسين الآسيويين
أمريكا الشمالية المحلية (15% من السعة العالمية):
-حجم الإنتاج: ~حوالي 63 مليار كوب (للاستهلاك المحلي في المقام الأول)
-التكلفة: $0.06-0.09 من المصنع (2-3 × الصين فوب)
-اللاعبون: حاويات دارت، وهتاماكي، وجورجيا-باسيفيك، وسولو كوب
-نقاط القوة: عدم التأخير في الاستيراد، وضمان الجودة/الشهادات
-نقاط الضعف: ارتفاع تكاليف العمالة/الطاقة، ومحدودية المنافسة السعرية
الاتحاد الأوروبي المحلي (10% من السعة العالمية):
-حجم الإنتاج: ~42 مليار كوب تقريبًا
-التكلفة: $0.07-0.11 خارج المصنع
-التنظيم: الامتثال الصارم لملامسة الأغذية والامتثال البيئي
-الاتجاه السائد: الاندماج (الجهات الفاعلة الرئيسية تستحوذ على مطاحن أصغر)
استخدام السعة (2024):
مكونات التكلفة (كوب قياسي مطلي بـ 12 أونصة من البولي إيثيلين البولي إيثيلين):
اتجاهات أسعار المواد الخام (2020-2025):
التأثير: أسعار الجملة للأكواب الورقية تتبع عن كثب أسواق اللب والPE مع فارق زمني يتراوح بين شهرين إلى ثلاثة أشهر. ويستفيد المشترون من تثبيت الأسعار خلال فترات انخفاض أسعار اللب (عادةً ما تكون من الربع الثالث إلى الربع الرابع).
مثال على التصدير إلى الصين (كوب 12 أونصة، مطلي بالبولي إيثيلين البولي إيثيلين، موك 500,000 قطعة):
هيكل ترميز الموزع:
-تكلفة الموزع: $0.03425 هبطت $0.03425
-المستودعات/المناولة: +$P0.008 لكل وحدة
-هامش الموزع:: 25-35% → +$0.011-0.015
-سعر الجملة للمشتري: $0.053-0.057 لكل وحدة
-ترميز نهاية البيع بالتجزئة (في حالة إعادة البيع): +30-501+TP3T → $0.069-0.086 لكل وحدة
النتائج الرئيسية: المستوردون الذين يشترون أكثر من 500,000 وحدة مباشرة من المصنعين يوفرون 35-50% مقابل الشراء من الموزعين المحليين، ولكن يجب عليهم إدارة المهل الزمنية التي تتراوح بين 60 و90 يومًا وضمان الجودة.
سعة الحاوية 20 قدماً:
حاوية عالية المكعبات بطول 40 قدماً:
-الطاقة الاستيعابية:: 2.2-2.5 × 2.2-2.5 × حاوية 20′′
-التكلفة: 1.6-1.8 × تكلفة شحن 20′′
-اقتصاديات الوحدة:: 20-30% 20-30% تكلفة شحن أفضل لكل كوب
محركات تكلفة الشحن البحري (2024-2025):
تقلبات سوق الشحن:
-2020-2021 (كوفيد): ارتفاع تكاليف الشحن 300-500%
-2023-2024: تطبيع إلى +60-801-80% فوق خط الأساس قبل COVID
-استراتيجية التحوط: كبار المشترين يتفاوضون على عقود سنوية مع شركات النقل للحصول على التزامات الحجم
أكواب مخزنة/عامة (أبيض/كرافت، بدون طباعة):
-موك: 10,000 - 50,000 وحدة
-المهلة الزمنية:: 7-15 يومًا (قبل التخزين في المستودع)
-السعر: الأعلى لكل وحدة (ولكن بأقل استثمار إجمالي)
-حالة الاستخدام: الطلبات العاجلة والمشغلين الصغار والمشتريات التجريبية
سهم + ملصق الشعار:
-موك:: 20,000-100,000 وحدة
-المهلة الزمنية: 15-25 يومًا (إنتاج كوب المخزون + وضع الملصق)
-السعر: +10-15% مقابل الطباعة المخصصة الكاملة
-حالة الاستخدام: العلامة التجارية على الميزانية، اتساق الامتياز دون تخصيص كامل
طباعة مخصصة بلون واحد مخصص 1 لون:
-موك: 50,000-100,000 وحدة
-المهلة الزمنية:: 25-35 يومًا (صنع الألواح + الإنتاج)
-تكلفة الإعداد: $300-800 (صنع الألواح/صنع القوالب)
-حالة الاستخدام: المقاهي، والسلاسل الصغيرة، والعلامات التجارية المباشرة
طباعة مخصصة بالألوان الكاملة (CMYK):
-موك: 100,000-300,000 وحدة
-المهلة الزمنية: 35-50 يومًا (الموافقة على التصميم ومطابقة الألوان والإنتاج)
-تكلفة الإعداد: $800-2,000
-السعر: +20-35% مقابل المخزون، ولكن تأثير العلامة التجارية المتفوقة
-حالة الاستخدام: السلاسل التجارية الكبرى، والعلامات التجارية الفاخرة، ومتاجر التجزئة البارزة
مخصص بالكامل (حجم/شكل/خامة فريدة من نوعها):
-موك: 300,000-1,000,000 وحدة (استهلاك أدوات القوالب)
-المهلة الزمنية:: 60-90 يوما
-تكلفة الإعداد: $3,000-10,000 (قوالب مخصصة، اختبار)
-حالة الاستخدام: ستاربكس ريزيرف ريزيرف، إصدارات محدودة، مشاريع الابتكار
حقائق الجدولة الزمنية للمصنعين:
-موسم الذروة (الربع الثالث - الربع الرابع، العطلات): مهلة 6-8 أسابيع حتى بالنسبة لطلبات المخزون
-الموسم المنخفض (الربع الأول - الربع الثاني): التفاوض على خصومات 10-20% للإنتاج خارج أوقات الذروة
-الطلبات المستعجلة:: 200-300% قسط 200-300% للإنتاج المعجل (إذا سمحت السعة)
تكاليف الاحتفاظ بالمخزون:
التوصية: اطلب توريد من شهرين إلى ثلاثة أشهر للأصناف سريعة الحركة، وشهر إلى شهرين للتصاميم المخصصة/الموسمية لتحقيق التوازن بين التكاليف والمرونة.
نقاط التحقق من الجودة الحرجة:
خدمات التفتيش من طرف ثالث:
-SGS, Intertek, TÜV، SGS, Intertek, TÜV: $500-1200 لكل فحص (عينة من 300-500 وحدة)
-وقت الاستخدام: الطلبية الأولى من مورد جديد، الإنتاج > 200,000 وحدة
-العائد على الاستثمار: يمنع $10,000 إلى 50,000 من الخسائر الناجمة عن الشحنات المعيبة
الشهادات الأساسية:
الإشارات الحمراء في فحص الموردين:
❌ رفض تدقيق المصنع: من المحتمل أن يخفي مشاكل في السعة أو الجودة
❌ لا توجد شهادات: المخاطر التنظيمية، قد تفشل الجمارك
❌ السعر 30%+ أقل من السوق: قطع الزوايا في مكان ما (المواد والعمالة والسلامة)
❌ عدم الرغبة في تقديم عينات: مخاوف تتعلق بالجودة
❌ لا توجد خبرة في التصدير: أخطاء في التوثيق، وتأخير في الشحن
توفر الشركة المصنعة/المصدرة:
يوفر المشتري/المستورد:
-رخصة الاستيراد (إذا كانت مطلوبة في بلد المقصد)
-الهوية الضريبية / تسجيل الاستيراد
-خطاب الاعتماد المستندي (إذا كان أجل الدفع هو خطاب الاعتماد)
الولايات المتحدة الأمريكية:
-رمز HS: 4823.69 (أصناف أخرى من لب الورق والورق وما إلى ذلك)
-معدل التعريفة: 0-5.51.5% (يعتمد على المادة والطلاء)
-الاتفاقيات التجارية: USMCA (0% من كندا/المكسيك)، نظام الأفضليات المعمم (يختلف)
الاتحاد الأوروبي:
-رمز HS: 4823.69
-معدل التعريفة: 0-6.5%
-الحواجز غير الجمركية: الامتثال لمعايير REACH (السلامة الكيميائية)، لائحة ملامسة الأغذية
المملكة المتحدة (ما بعد خروج بريطانيا من الاتحاد الأوروبي):
-رمز HS: 4823.69
-معدل التعريفة: 0-6.51.5% (متوافقة مع الاتحاد الأوروبي في الوقت الحالي)
-المتطلبات الفريدة: وسم UKCA للمواد الملامسة للأغذية
الشرق الأوسط (الإمارات العربية المتحدة، المملكة العربية السعودية):
-معدل التعريفة: 5-10%
-شهادة الحلال: غير مطلوب للأكواب الورقية ولكن بعض المشترين يطلبون
-معايير SASO/ESMA: شهادات سلامة المنتج
إستراتيجيات التوفير في الواجبات:
-مناطق التجارة الحرة: الاستيراد إلى منطقة التجارة الحرة، ودفع الرسوم الجمركية فقط عند الإفراج عنها إلى السوق (تأجيل التدفق النقدي)
-المستودعات المرهونة: تخزين البضائع المستوردة دون دفع الرسوم الجمركية حتى بيعها
-هندسة التعريفة الجمركية: تعديل مواصفات المنتج للتأهل لتصنيف رمز النظام المنسق المنخفض
تعافي الخدمات الغذائية (ما بعد الجائحة):
-2024: حركة الخدمات الغذائية عند 102% من مستويات عام 2019 (التعافي الكامل + النمو)
-معدل النمو السنوي المركب المركب 2025-2030: 4.2% نمو الطلب على الأكواب الورقية للخدمات الغذائية
-سائق: التوسع في المطاعم السريعة وثقافة القهوة في الأسواق الناشئة
ولايات الاستدامة:
-حظر استخدام البلاستيك الذي يستخدم لمرة واحدة:: 72 دولة ذات حظر نشط بحلول عام 2025 ← استبدال الأكواب الورقية
-الحوكمة البيئية والاجتماعية والمؤسسية للشركات: سلاسل كبرى (ماكدونالدز وستاربكس) تلتزم بالتغليف المستدام 100% بحلول 2025-2030
-تفضيلات المستهلك:: 68% على استعداد لدفع 5-10% أكثر مقابل خيارات مستدامة
التجارة الإلكترونية والتوصيل:
-نمو توصيل الوجبات: معدل النمو السنوي المركب 12% (2024-2028) → زيادة استخدام أكواب الوجبات الجاهزة
-مطابخ الأشباح:: أكثر من 2,500 عملية تشغيلية في الولايات المتحدة وحدها → شراء الأكواب بالجملة
توسيع القدرات الاستيعابية:
-الهند: استثمار $2.1 مليار دولار في طاقة التغليف الورقية (2024-2027)
-جنوب شرق آسيا: زيادة الإنتاج في فيتنام وإندونيسيا (ميزة تكلفة العمالة)
-النقل إلى الخارج: المكسيك تضيف 3 مصانع رئيسية لخدمة سوق الولايات المتحدة (تقليل وقت/تكاليف الشحن)
الابتكار في المواد:
-الطلاءات ذات الأساس مائي: اعتماد 18% في عام 2024 → 45% المتوقعة بحلول عام 2028 (إمكانية إعادة التدوير)
-طلاءات PLA: 12% في عام 2024 → 22% بحلول عام 2028 (الطلب على التسميد)
-تكنولوجيا الحواجز: الطلاءات المعدنية (غير البلاستيكية) الناشئة (اعتماد 3% حالياً)
توقعات الأسعار (2025-2030):
#P5T# توصيات التوريد الاستراتيجي
سلاسل صغيرة (50,000-200,000 كوب/شهر):
-الاستراتيجية: الشراء من الموزعين المحليين لأول سنة أو سنتين (تقليل التعقيدات)
-المرحلة الانتقالية: بمجرد أن يتجاوز الحجم 200,000/شهرًا، اختبر الاستيراد المباشر (1-2 حاوية)
-عدد الموردين: الحفاظ على 2 من الموردين (أساسي + احتياطي) للتخفيف من المخاطر
سلاسل متوسطة (500,000-2,000,000 كوب/شهر):
-الاستراتيجية: الاستيراد المباشر من 1-2 مصنعين آسيويين (الصين/الهند)، الدعم المحلي
-العقد: التزامات الحجم السنوية لتخفيضات الأسعار 5-10%
-الجودة: استئجار طرف ثالث للتفتيش (SGS) لكل شحنة
الشركات الكبيرة (أكثر من 5,000,000 كوب/شهر):
-الاستراتيجية: متعدد المصادر (آسيا أولية، ثانوية محلية، ناشئة قريبة من الشاطئ)
-شراكات التصنيع: المشاركة في الاستثمار في خطوط الإنتاج المخصصة للمواصفات المخصصة
-الخدمات اللوجستية: التعاقد مباشرة مع خطوط الشحن (تجنب هوامش الربح التي يفرضها وكيل الشحن)
-التحوط: الأدوات المالية لتثبيت تكاليف المواد الخام (العقود الآجلة لللباب)
نقاط الرافعة المالية:
1.التزامات الحجم: ضمان توقعات لمدة 12 شهرًا بخصم 8-12% المضمون
2.شروط الدفع: الدفع المسبق (إيداع 501 تيرابايت 3 تيرابايت 3 تيرابايت 3 تيرابايت) يفتح امتياز التسعير 3-51 تيرابايت 3 تيرابايت 3 تيرابايت
3.المرونة: قبول مهل زمنية أطول (90 يومًا مقابل 60 يومًا) لتحقيق وفورات 5-8%
4.الإنتاج خارج أوقات الذروة: الطلب في الربع الأول - الربع الثاني (الموسم المنخفض) للحصول على خصومات 10-15%
الخطوط الحمراء (لا تساوم):
-شهادات الجودة: تتطلب دائمًا امتثال إدارة الغذاء والدواء/الاتحاد الأوروبي (غير قابل للتفاوض)
-حقوق التفتيش: الاحتفاظ بالحق في تدقيق المصنع قبل الطلبيات الكبيرة
-القوة القاهرة: وضع حد أقصى للمسؤولية عن تعطل سلسلة التوريد ولكن مع ضمان التوريد الاحتياطي
❌ الخطأ #1: اختيار المورد فقط على أقل سعر دون تدقيق المصنع
✅ النهج الصحيح: زيارة المصنع أو استئجار مفتش من طرف ثالث للطلبات التي تزيد عن 1 تيرابايت و50,000 تيرابايت. التحقق من عمر المعدات، ومصادر المواد الخام، وضوابط الجودة
❌ الخطأ #2: طلب ما تحتاجه بالضبط بدون مخزن مؤقت
✅ النهج الصحيح: إضافة مخزون أمان 3-5% للطلب. ستحدث تأخيرات في الشحن، وحالات رفض الجودة، وارتفاع الطلب - المخزون الاحتياطي يمنع نفاذ المخزون
❌ الخطأ #3: الدفع عن طريق التحويل البنكي قبل الإنتاج/التفتيش
✅ النهج الصحيح: استخدم خطاب الاعتماد أو خدمات الضمان للطلبات 2-3 الأولى. الإفراج عن 70% عند المعاينة، 30% عند التسليم
❌ الخطأ #4: تجاهل تحسين تصنيف التعريفة الجمركية
✅ النهج الصحيح: العمل مع المخلص الجمركي للتحقق من رمز النظام المنسق. يمكن أن تؤدي التغييرات الصغيرة في المواصفات إلى تغيير التعريفة الجمركية من 5.5% إلى 0%
يتألف سوق بيع الأكواب الورقية بالجملة من معاملات B2B حيث يشتري المشترون أكثر من 10,000 وحدة لكل طلب من المصنعين أو الموزعين. وقد نقلت $18.2 مليار دولار أمريكي على مستوى العالم في عام 2024 (420 مليار وحدة) عبر قنوات الخدمات الغذائية والمؤسسات وقنوات البيع بالتجزئة.
تختلف موك حسب التخصيص: 10,000 إلى 50,000 للأكواب المخزونة، و50,000 إلى 100,000 للطباعة بلون واحد، و100,000 إلى 300,000 للطباعة الكاملة بلون CMYK، و300,000 إلى 1,000,000 للأحجام/الأشكال المخصصة. تفضل اقتصاديات حمولة الحاويات أكثر من 500,000 وحدة للاستيراد.
الأكواب القياسية المغطاة بالبولي إيثيلين البولي إيثيلين سعة 12 أونصة: $0.020-0.030 فوب الصين، $0.035-0.045 فوب تركيا، $0.06-0.09 من المصنع في أمريكا الشمالية، $0.053-0.057 من الموزعين الأمريكيين (سعر البيع + هامش الربح). يضيف طلاء PLA القابل للتحويل إلى سماد 20-35% علاوة.
المخزون/العامة: 7-15 يومًا، الطباعة المخصصة: 25-50 يومًا، الشحن البحري يضيف 14-38 يومًا (الصين ← الولايات المتحدة)، دورة كاملة من أمر الشراء إلى التسليم: 45-90 يومًا للواردات، 15-30 يومًا للواردات المحلية. موسم الذروة (الربع الثالث - الربع الرابع) يضيف 2-4 أسابيع.
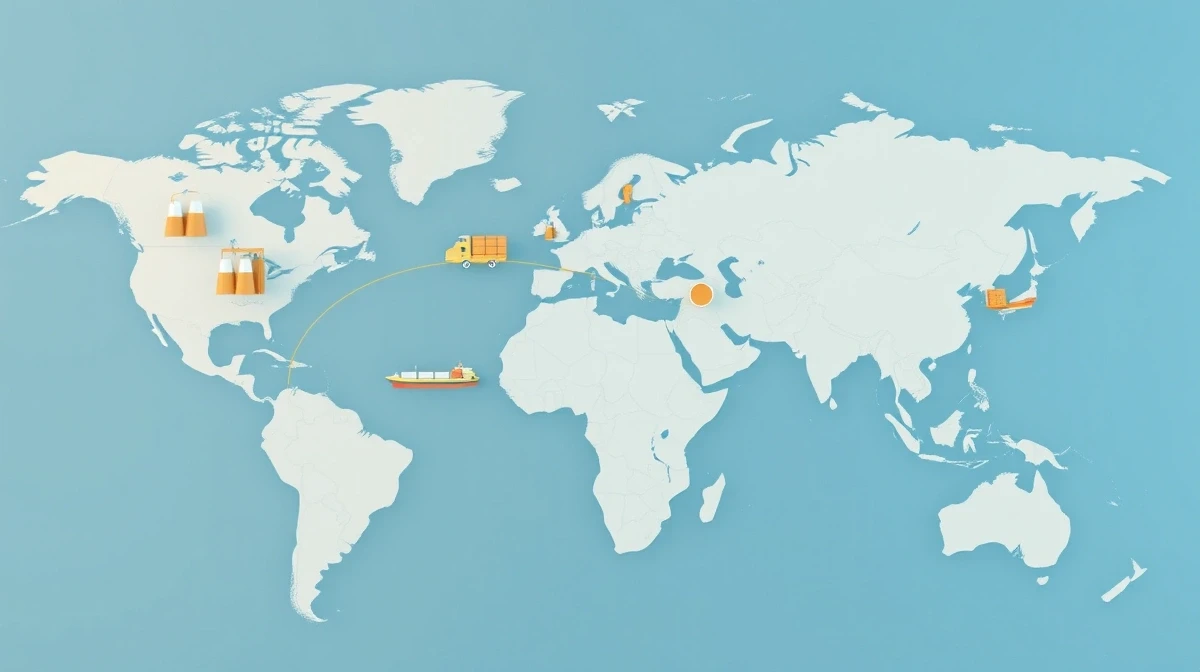
وتنتج الصين 45% من السعة العالمية (حوالي 190 مليار كوب/سنة)، والهند 12%، وتركيا 8%، وأمريكا الشمالية 15%، والاتحاد الأوروبي 10%. تقدم الصين أقل التكاليف على ظهر السفينة ($0.020T-0.030T) ولكن الشحن أطول. توفر تركيا ميزة القرب من الاتحاد الأوروبي.
FDA ملامسة الأغذية الإخطار (سوق الولايات المتحدة), لائحة الاتحاد الأوروبي 10/2011 الامتثال (أوروبا)، FSC/PEFC (الغابات المستدامة), آيزو 9001 (إدارة الجودة). يوصى بإجراء اختبار من طرف ثالث (SGS، Intertek) للطلبات الأولى وشحنات الوحدات التي تزيد عن 200,000 وحدة.
التوريد المباشر من المصنعين (توفير 35-50% مقابل الموزعين)، وطلبات حمولة الحاويات (أكثر من 500,000 وحدة)، والتزامات الحجم السنوية (خصم 8-12%)، والإنتاج خارج أوقات الذروة (خصم 10-15%)، والمنافسة متعددة المصادر، وتحسين مدة السداد (الدفع المسبق يفتح 3-5%).
يعمل سوق بيع الأكواب الورقية بالجملة كنظام بيئي عالمي معقد تتقاطع فيه تقلبات المواد الخام، والقدرة التصنيعية، ولوجستيات الشحن، والامتثال التنظيمي لتحديد الأسعار والتوافر. لا يتنقل المشترون الناجحون في هذا المشهد ليس من خلال عمليات الشراء لمرة واحدة ولكن من خلال علاقات الموردين الاستراتيجية، وتنويع سلسلة التوريد، وإدارة الجودة الاستباقية.
الوجبات السريعة الرئيسية:
1.مراجحة التكلفة الجغرافية كبيرة: فوب الصين ($0.020-0.030) مقابل أمريكا الشمالية المحلية ($0.06-0.09) يحقق وفورات تتراوح بين 35-50% للمستوردين الراغبين في إدارة مهل زمنية تتراوح بين 60-90 يومًا
2.أهمية اقتصاديات حمولة الحاويات: تعمل طلبات شراء أكثر من 500,000 وحدة على تحسين تكاليف الشحن (وفورات 401 تيرابايت 3 تيرابايت + لكل وحدة مقابل الشحن الجوي/شحن LCL)
3.ضمان الجودة غير قابل للتفاوض: التفتيش من قبل طرف ثالث ($500-1200) يمنع $10,000-50,000 خسائر من الشحنات المعيبة
4.تعدد المصادر يخفف من المخاطر: المورد الآسيوي الرئيسي + الاحتياطي المحلي يوازن بين التكلفة وأمن الإمدادات
5.الاستدامة هي الدافع وراء التسعير المستقبلي: الطلاءات ذات الأساس المائي/جزيئات اللدائن ذات الأساس المائي/جزيئات اللدائن البلاستيكية ذات الأساس المائي تتقاضى 20-35% أقساطاً الآن ولكنها ستصبح خط الأساس مع تشديد اللوائح (2025-2030)
سواء أكنت موزعًا يقوم بتوحيد التوريد، أو سلسلة مطاعم للوجبات السريعة تعمل على تحسين المشتريات، أو مستوردًا يقوم ببناء محفظة منتجات ورقية، فإن فهم ديناميكيات سلسلة التوريد هذه يمكّنك من التفاوض على شروط أفضل، وإدارة المخاطر بشكل استباقي، والاستفادة من أوجه القصور في السوق التي تفصل بين العمليات المربحة وتآكل الهامش.
تقوم شركة Papacko بتصنيع وتصدير الأكواب الورقية إلى أكثر من 45 دولة بطاقة إنتاجية تبلغ 12 مليار وحدة سنويًا. نحن نقدم موك من 50,000 وحدة، ومواد معتمدة من إدارة الأغذية والعقاقير/الاتحاد الأوروبي، والشحن المباشر بحمولة حاوية كاملة. تشمل سلسلة التوريد لدينا تخطيط الإنتاج لمدة 60 يومًا، وفحص ما قبل الشحن من قِبل شركة SGS، ومعالجة وثائق التصدير.
Wholesale sourcing decisions usually depend on demand signals, chain-level buying requirements, export paperwork, and a clear view of the production system behind the quote.
تواصل معنا
آخر تحديث: نوفمبر 2025