¿Está listo para crear sus propios vasos o envases de papel con su marca?
Díganos sus requisitos -tamaño, revestimiento, impresión y destino- y nuestro equipo le preparará un presupuesto detallado en 24 horas.
Última actualización: Noviembre de 2025
Tiempo de lectura: 8-10 minutos
Autor: Equipo de contenidos de Papacko
El mercado de los envases ecológicos está experimentando un crecimiento sin precedentes. La demanda mundial de soluciones de envasado sostenibles alcanzó los 1.4T267.000 millones en 2024, y las previsiones indican que llegará a los 1.4T413.000 millones en 2030, lo que supone una tasa de crecimiento anual compuesto (TCAC) del 7,5%. Pero detrás de estas cifras se esconden cambios fundamentales en la normativa, el comportamiento de los consumidores y la innovación de materiales que están reconfigurando todo el sector del envasado alimentario.
Esta guía, basada en datos, analiza las fuerzas que impulsan la adopción de envases ecológicos, desglosa la dinámica del mercado regional y ofrece información práctica para las empresas que se enfrentan a esta transformación.
En este artículo, descubrirá:
-Tamaño del mercado y previsiones de crecimiento entre regiones y categorías de materiales
-Factores reglamentarios dar forma a los requisitos de envasado en la UE, Norteamérica y Asia
-Tendencias en el comportamiento de los consumidores influir en las decisiones de compra
-Innovación de materiales y tecnologías emergentes
💡 Comida rápida para llevar: El mercado de envases ecológicos no sólo crece, sino que se acelera.
Las empresas que invierten en envases sostenibles obtienen ahora una ventaja competitiva, el cumplimiento de la normativa y el acceso a segmentos de consumidores premium dispuestos a pagar 10-15% más por productos ecológicos.
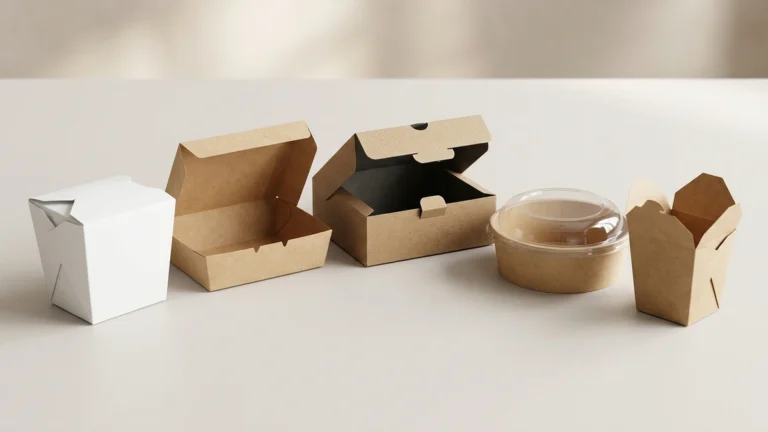
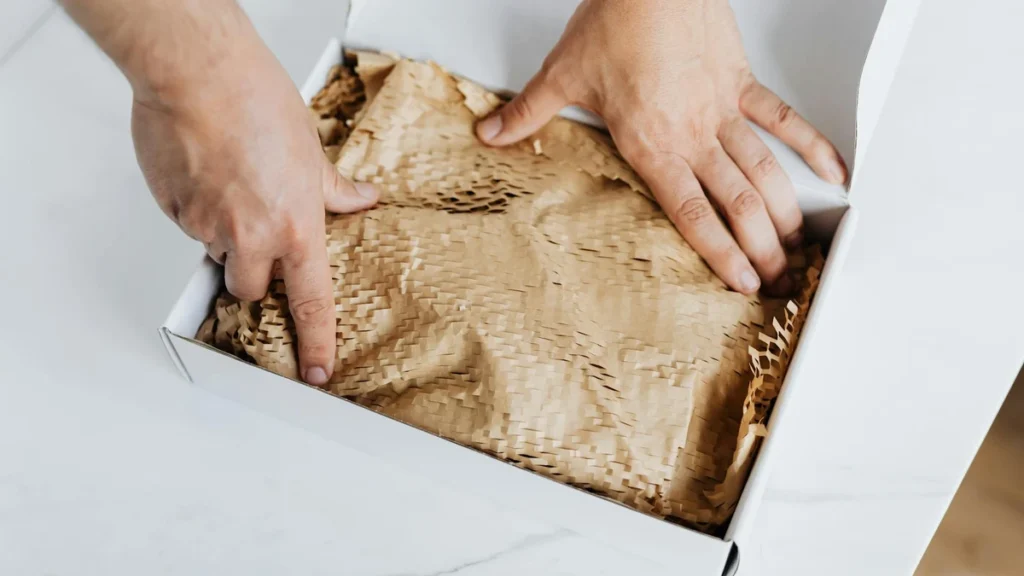
El mercado de envases ecológicos engloba todos los materiales y soluciones de envasado diseñados para minimizar el impacto ambiental mediante:
-Materiales reciclables (papel, cartón, determinados plásticos)
-Opciones compostables/biodegradables (PLA, fibra moldeada, bagazo)
-Sistemas reutilizables (sistemas de depósito y devolución, contenedores rellenables)
-Reducción del uso de material (aligeramiento, diseño minimalista)
Segmentos de mercado:
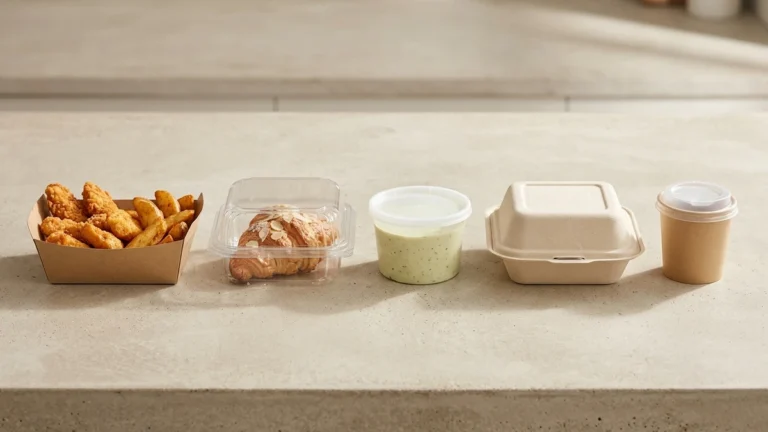
Aplicaciones clave:
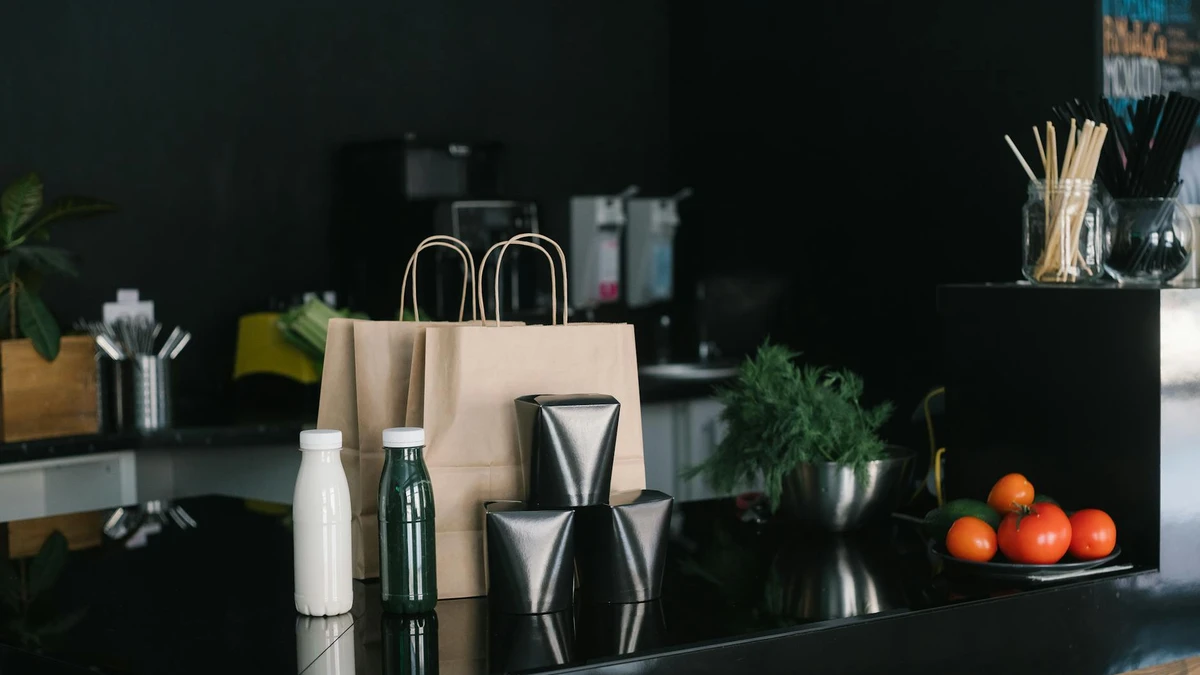
-Restauración (vasos, cuencos, envases para comida para llevar): 42% del mercado de envases ecológicos
-Envasado de alimentos al por menor (productos frescos, panadería): 28%
-Comercio electrónico: 15%
-Cuidado personal/Cosmética: 10%
-Otros: 5%
🎯 Perspectiva del sector: La restauración domina la demanda de envases ecológicos porque la presión normativa y la visibilidad del consumidor son mayores en este sector.
Los restaurantes de comida rápida se enfrentan a un riesgo de marca inmediato derivado de los envases no sostenibles.
Principales mercados en crecimiento (2024-2030):
1.India: 11,2% CAGR (impulsado por la prohibición del plástico de un solo uso en 2022)
2.Indonesia: 10,8% CAGR (compromisos de sostenibilidad de la ASEAN)
3.Alemania9,5% CAGR (cumplimiento de la Ley de Envases, sistemas de depósito)
4.Reino Unido: 9,1% CAGR (Impuesto sobre envases de plástico)
5.Estados Unidos7,9% CAGR (divergencia a nivel estatal, California a la cabeza)
Crecimiento de los envases de papel:
-Tamaño del mercado en 2024: $101 mil millones
-Proyección 2030: $148 mil millones
-CAGR: 6.8%
-Productos clave: Vasos de papel, cajas de alimentos, bolsas de la compra, envases de fibra moldeada
Por qué el papel lidera: Infraestructura de reciclado establecida, familiaridad del consumidor, competitividad de costes con los plásticos convencionales en muchas aplicaciones.
Crecimiento de los bioplásticos:
-Tamaño del mercado en 2024: $32 mil millones
-Proyección 2030: $64 mil millones
-CAGR: 12.3%
-Productos clave: Vasos recubiertos de PLA, cubiertos compostables, películas de base biológica
Desafío: Requiere instalaciones industriales de compostaje aún no disponibles en muchos mercados. La contaminación de los flujos de reciclado sigue siendo motivo de preocupación.
Directiva de la UE sobre plásticos de un solo uso (2021):
-Prohibición de platos, cubiertos, pajitas, agitadores y palos de globo de plástico
-Obliga a recoger 90% de botellas PET para 2029
-Exige la responsabilidad ampliada del productor (RAP) para todos los envases
Impacto en el mercado de los envases ecológicos:
Impuesto sobre envases de plástico en el Reino Unido (2022):
-200 libras/tonelada de impuesto sobre los envases de plástico con contenido reciclado <30%
-Impulsa el cambio a alternativas basadas en papel o un mayor contenido de plástico reciclado
-Resultado: 24% de aumento de la demanda de kraft reciclado recipientes para alimentos
Estados Unidos (variación por estados):
Canadá:
-Prohibición federal de los plásticos de un solo uso (implantación gradual en 2022-2025)
-Afecta a las bolsas de la caja, los cubiertos, las pajitas, los palitos para remover, los envases de comida para llevar
-Impacto en el mercado: crecimiento anual de 19% en envases compostables para servicios alimentarios
China:
-2020: Prohibición de las bolsas de plástico no degradables en las grandes ciudades
-2022: Ampliado a todas las ciudades y condados
-Objetivo para 2025: 40% de reducción del consumo de plástico de un solo uso
-Impacto en el mercado: $12.000 millones de inversión en capacidad de producción de papel y envases biológicos
Japón:
-Ley de Circulación de Recursos Plásticos (2022)
-Tasas obligatorias para bolsas de plástico y cubiertos
-Objetivo: 60% de tasa de reciclado de envases de plástico para 2030
-Resultado: 17% de aumento de los envases de papel para llevar
India:
-Prohibición en 2022 de los artículos de plástico de un solo uso identificados
-Requisitos de grosor de las bolsas de plástico autorizadas
-Respuesta del mercado: Aumento de la demanda de alternativas a la hoja de plátano, el bagazo y el papel (+35% de crecimiento en 2022-2024)
Pregunta: “¿Elegiría un producto con envase ecológico frente a uno convencional si el precio fuera el mismo?”.”
Voluntad de primas:
Información clave: El “punto dulce” es la prima de 5-10%. Por encima de 15%, solo los primeros ecoconscientes están dispuestos a pagar.
Restauración:
-78% de los consumidores esperan que los cafés y restaurantes utilicen envases compostables o reciclables
-62% evitaría activamente que las empresas utilizaran envases de poliestireno expandido
-54% fotografiar y compartir envases sostenibles estéticamente agradables en las redes sociales
Comercio electrónico:
-71% prefiere un embalaje mínimo con materiales reciclados
-49% elegiría un minorista en lugar de otro por sus envases sostenibles
-38% han dejado de comprar a una marca debido al exceso de residuos de envases
Áreas de innovación del papel:
1.Revestimientos barrera: Revestimientos a base de agua y minerales que sustituyen al PLA/PE para mejorar la reciclabilidad
2.Fibra moldeada: Conformado 3D de formas complejas (cuencos, bivalvas) con un mínimo de material
3.Nanocelulosa: Películas ultrafinas y resistentes con propiedades de barrera al oxígeno y la humedad
Principales inversiones de las empresas (2023-2024):
-Nestlé: Compromiso de $2.100 millones para I+D en envases sostenibles de aquí a 2025
-Unilever: Transición a envases reutilizables, reciclables o compostables 100% para 2025
-McDonald's: $1.400 millones invertidos en infraestructura de envasado basada en fibra
-Starbucks: Eliminación de las pajitas de plástico en todo el mundo (sustitución de 1.000 millones de pajitas al año)
Actividad de fusiones y adquisiciones:
-Empresas de envases de papel adquieren 37 startups de materiales de base biológica (2023)
-Prima media de adquisición: 42% por encima de la valoración de mercado
-Áreas de interés: Alternativas de revestimiento de PLA, tecnología de fibra moldeada, abastecimiento de contenido reciclado
Disponibilidad de instalaciones de compostaje:
Problema: Los vasos recubiertos de PLA y los envases compostables requieren un compostaje industrial (55-60°C durante más de 12 semanas). Sin esta infraestructura, contaminan los flujos de reciclaje o acaban en vertederos donde no se biodegradan.
Comparación de precios (por unidad, precios al por mayor):
Análisis del punto de equilibrio:
-Operaciones de gran volumen (>50.000 unidades/mes): La prima se reduce a 20-40% con abastecimiento directo del fabricante
-Pequeñas empresas (<5.000 unidades/mes): Afrontar 80-150% prima debido a las limitaciones MOQ y márgenes de distribución.
Malentendidos comunes:
1.“Biodegradable = seguro para el medio ambiente”: No es cierto si los artículos acaban en vertederos sin oxígeno/microbios
2.“Todos los envases de papel son reciclables”: El falso papel estucado contamina a menudo los flujos de reciclado
3.“Compostable significa compostable en casa”: La mayoría requieren instalaciones industriales a temperaturas específicas
Respuesta del sector: Normas de etiquetado más claras, marcas de certificación (BPI, TÜV Austria, logotipo Seedling), campañas de educación de los consumidores.
Evalúe su posición en el mercado:
### ROI más allá del coste
Beneficios tangibles:
-Cumplimiento de la normativa: Evitar multas ($5.000-$50.000/violación en algunas jurisdicciones).
-Acceso al mercado: Requerido para contratos con grandes minoristas/cadenas
-Gestión de residuos: Ahorro potencial en costes de eliminación en sistemas de pago por peso
Beneficios intangibles:
-Valor de marca: 37% de los millennials dispuestos a cambiar de marca por envases sostenibles
-Redes sociales: 54% mayor compromiso en los mensajes que incluyen envases ecológicos
-Moral de los empleados68% de los trabajadores prefieren empleadores con compromisos de sostenibilidad
❌ Error #1: Asumir que las afirmaciones “ecológicas” no requieren justificación
✅ Enfoque correcto: Obtener certificaciones de terceros (FSC, BPI, TÜV) y comunicar claramente las limitaciones (por ejemplo, “compostable industrialmente”).
❌ Error #2: Cambiar a los bioplásticos sin verificar la infraestructura local de compostaje
✅ Enfoque correcto: Audite las capacidades de gestión de residuos de su región y elija materiales que se ajusten a los sistemas de fin de vida útil disponibles.
❌ Error #3: Subestimación de los plazos de la cadena de suministro de envases ecológicos
✅ Enfoque correcto: Planifique de 8 a 12 semanas para los envases personalizados de papel o de base biológica, frente a las 2 a 4 semanas para los de plástico convencional.
❌ Error #4: Ignorar el impacto medioambiental total del ciclo de vida
✅ Enfoque correcto: Realizar un ACV (análisis del ciclo de vida) para verificar que la alternativa ecológica reduce realmente el impacto neto (algunas requieren más energía/agua en la producción).
El mercado de envases ecológicos engloba todos los materiales de envasado diseñados para minimizar el impacto medioambiental mediante el reciclado, la compostabilidad, la reutilización o la reducción del uso de materiales. Alcanzó $267 mil millones a nivel mundial en 2024 y se prevé que crezca hasta $413 mil millones en 2030.
El mercado mundial de envases ecológicos crecerá a una tasa compuesta de crecimiento anual (TCAC) de 7,5% entre 2024 y 2030. El segmento de los bioplásticos crece más rápido (12,3% CAGR), mientras que los plásticos convencionales disminuyen (-2,1% CAGR).
Los principales impulsores son: (1) Mandatos normativos (Directiva sobre plásticos de un solo uso de la UE, prohibiciones a nivel estatal en EE.UU./Canadá), (2) Demanda de los consumidores (68% prefieren envases sostenibles a precios comparables), y (3) Compromisos corporativos ESG de las grandes marcas.
Sí. Los envases ecológicos suelen costar entre 30 y 150% más que los equivalentes de plástico convencional, en función del material y el volumen. Los compradores de gran volumen (>50.000 unidades/mes) pueden reducir este sobrecoste a 20-40% gracias a las relaciones directas con los fabricantes.
Europa lidera el mercado con 1.4T98.000 millones de euros y una tasa interanual de crecimiento del 8,2%, impulsada por la exhaustiva normativa de la UE. Asia-Pacífico muestra un fuerte crecimiento (7,9% CAGR) liderado por las políticas de residuos plásticos de China y las prohibiciones de un solo uso de la India.
Principales retos: (1) Insuficiente infraestructura de compostaje para los bioplásticos, (2) Las primas de coste limitan la adopción por parte de las pequeñas empresas, (3) Confusión de los consumidores sobre los métodos de eliminación, y (4) Lagunas de rendimiento en la resistencia a la humedad y la vida útil de algunos materiales.
No. Se calcula que los envases ecológicos acapararán 70% de envases para servicios alimentarios y 55% de envases para alimentos al por menor en 2030, pero los plásticos convencionales persistirán en aplicaciones que requieran una durabilidad extrema, propiedades de barrera u optimización de costes.
La trayectoria de crecimiento del mercado de envases ecológicos refleja una reestructuración fundamental de la industria mundial del envasado. El impulso normativo, las preferencias de los consumidores y los compromisos de sostenibilidad de las empresas se han alineado para crear un impulso irreversible hacia alternativas sostenibles.
Principales conclusiones:
1.El tamaño del mercado aumentará 55% de 2024 ($267B) a 2030 ($413B), siendo los bioplásticos los que más crecerán (12,3% CAGR)
2.La presión normativa impulsa la adopción más de lo que el consumidor está dispuesto a pagar, sobre todo en la UE y en los Estados progresistas de EE.UU.
3.Predominio de los envases de papel transiciones actuales debido a la infraestructura de reciclado establecida y a la competitividad de los costes.
4.Las carencias en infraestructuras limitan los bioplásticos: Sólo 18-32% de las poblaciones tienen acceso al compostaje industrial necesario para los materiales PLA
5.Las primas de precios se reducen: Los compradores a granel pagan ahora 20-40% más frente a los 80-150% de los pequeños compradores
Las empresas que realizan una transición proactiva a los envases ecológicos se benefician del cumplimiento de la normativa, el valor de la marca y el acceso a segmentos de consumidores en crecimiento. Las que se retrasan se enfrentan a costes crecientes derivados de la normativa, restricciones de acceso al mercado y riesgos para la reputación de la marca.
Papacko fabrica una gama completa de soluciones sostenibles de envasado de alimentos que incluye vasos de papel, envases de fibra moldeada y accesorios compostables. Nuestros productos cumplen las normas reglamentarias de la UE y Norteamérica y están certificados para su reciclado o compostaje industrial.
Market-growth pages are most useful when they connect numbers to operational choices: certification, legal pressure, and which sustainability routes are commercially actionable right now. These pages help bridge trend data with execution.
Póngase en contacto:
Última actualización: Noviembre de 2025