¿Está listo para crear sus propios vasos o envases de papel con su marca?
Díganos sus requisitos -tamaño, revestimiento, impresión y destino- y nuestro equipo le preparará un presupuesto detallado en 24 horas.
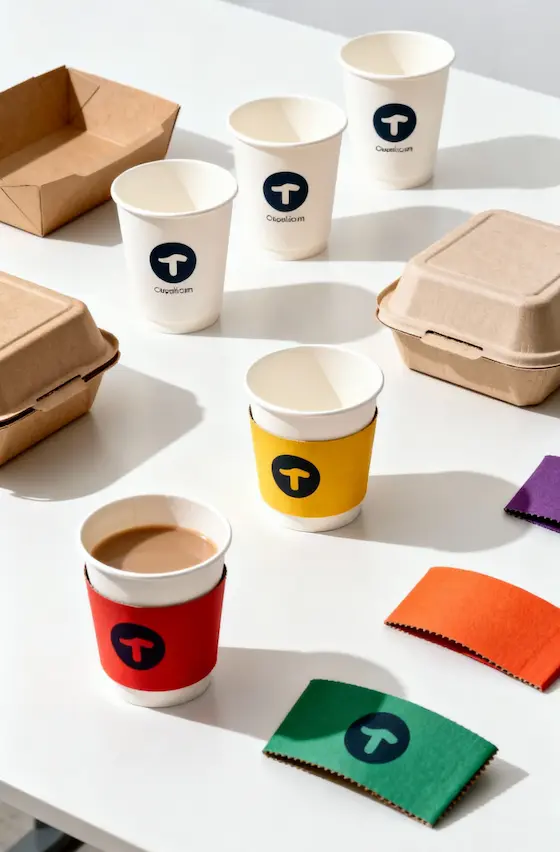
Los accesorios de envasado de alimentos —servilletas, fundas para vasos, pajitas, cubiertos, pegatinas y cierres especiales— representan oportunidades de promoción de marca infrautilizadas que generan entre 4 y 7 impresiones en los clientes por transacción, a un coste entre un 60 % y un 80 % inferior al de la publicidad tradicional. Sin embargo, el 73 % de los operadores de servicios de restauración pasan por alto la personalización de los accesorios, recurriendo por defecto a servilletas blancas genéricas y cubiertos sin marca que no refuerzan la identidad de marca en momentos cruciales del consumo.
La personalización estratégica de los accesorios transforma los artículos desechables funcionales en activos de marketing que actúan de forma continua a lo largo de todo el recorrido del cliente: servilletas con la marca que aparecen en las fotos de comida de las redes sociales, fundas personalizadas que protegen las manos al tiempo que promocionan los programas de fidelización, pajitas impresas que dan pie a conversaciones en las mesas y pegatinas con códigos QR que conectan el embalaje físico con la interacción digital. Estos puntos de contacto proporcionan exposición de marca cuando los clientes son más receptivos: mientras disfrutan activamente de tus productos de comida o bebida.
Esta guía completa ayuda a los operadores de restaurantes, propietarios de cafeterías, food trucks, empresas de catering y servicios de reparto a aprovechar los accesorios de embalaje para reforzar la imagen de marca, captar clientes y fidelizarlos. Tanto si se trata de una startup con un solo local como de una cadena con múltiples establecimientos, aprenderá qué accesorios generan un mayor retorno de la inversión, cómo integrar mensajes promocionales de forma eficaz y estrategias para medir el impacto de la marca a través de programas de envases personalizados.
Puntos clave tratados:-Tipos de accesorios de gran impacto y opciones de personalización
-Análisis del retorno de la inversión y modelos de coste-beneficio para accesorios personalizados
-Estrategias promocionales que integran los accesorios en las campañas de marketing
-Métodos de medición para cuantificar la exposición de la marca y la respuesta de los clientes
💡 Comida rápida para llevar: Las servilletas, los fundas para vasos y las pegatinas personalizadas con la marca generan entre 280 y 420 impresiones de marca por cada 100 euros invertidos —lo que supone un coste por impresión entre 6 y 9 veces mejor que el de la publicidad digital—, al tiempo que mejoran la percepción de calidad, refuerzan la visibilidad en las redes sociales y crean recordatorios físicos que fomentan las visitas repetidas.
Los accesorios de envasado de alimentos para la promoción de marcas son artículos desechables funcionales —servilletas, fundas para vasos, pajitas, cubiertos, bolsas y etiquetas— que se personalizan con impresiones a medida para mostrar logotipos de marca, mensajes promocionales, perfiles en redes sociales o creatividades de campaña. A diferencia del envase primario (recipientes, vasos, cajas), diseñado principalmente para la protección y el transporte de los alimentos, los accesorios cumplen funciones complementarias al tiempo que ofrecen un espacio privilegiado para la marca gracias a su gran visibilidad y al prolongado tiempo de contacto con el cliente.
Estos accesorios promocionales cumplen una doble función:
Función: Servicio básico que ofrece comodidad al cliente y eficiencia operativa-Las servilletas absorben los derrames y facilitan comer sin mancharse
-Las fundas para tazas protegen las manos del calor de las bebidas calientes
-Las pajitas permiten beber
-Los cubiertos permiten comer sin necesidad de llevar los propios
-Las bolsas transportan los pedidos
-Las etiquetas adhesivas sellan los envases y sirven como indicador de manipulación
Puesto de marketing: Comunicación de marca y fidelización de los clientes durante la experiencia de consumo-La colocación del logotipo refuerza el reconocimiento de la marca cada vez que se utiliza
-Los mensajes promocionales impulsan acciones concretas por parte de los clientes (descargas de aplicaciones, inscripción en programas de fidelización, compartir en redes sociales)
-Los elementos de diseño visual transmiten la personalidad y el posicionamiento de la marca
-La información de contacto (página web, redes sociales, teléfono) permite realizar un seguimiento de los clientes
-El material creativo de la campaña sirve de apoyo a promociones por tiempo limitado o iniciativas de temporada
Los accesorios para el envasado de alimentos ocupan una posición privilegiada en el mercado en comparación con la publicidad tradicional:
Duración de exposición prolongada: A diferencia de las impresiones fugaces de las vallas publicitarias o los anuncios digitales (con una duración media de 2-3 segundos), los accesorios de marca permanecen en manos de los clientes durante 10-20 minutos mientras consumen el producto, lo que genera un contacto prolongado con la marca y una mayor retención del mensaje.Asociación de Contextos de Consumo: Los accesorios acompañan a las experiencias gastronómicas y de bebidas, creando asociaciones emocionales positivas con la marca. Esto contrasta con la publicidad, que interrumpe otras actividades y suele generar un sentimiento negativo.Potencial de difusión en redes sociales: Los clientes suelen fotografiar la comida y la bebida para compartirlas en las redes sociales. Los accesorios de marca que aparecen en estas imágenes amplían el alcance de la marca a los seguidores de los fotógrafos —a veces, a cientos o incluso miles de impresiones adicionales— sin ningún coste adicional.Creación de recordatorios físicos: A diferencia de los anuncios digitales, que desaparecen tras su visualización, los accesorios físicos (servilletas guardadas en los bolsillos, bolsas reutilizadas para otros fines, pegatinas pegadas en los ordenadores portátiles) constituyen recordatorios duraderos de la marca que estimulan futuras visitas.La estrategia de utilizar accesorios promocionales resulta especialmente beneficiosa para las empresas en las que:
-Los puntos de contacto con el cliente son breves pero frecuentes (cafeterías, restaurantes de comida rápida)
-Es habitual compartir contenido en las redes sociales (comida digna de Instagram, bebidas artesanales, conceptos de moda)
-La frecuencia de las visitas repetidas es fundamental para el modelo de negocio (conceptos basados en la fidelización)
-Diferenciarse de la competencia es todo un reto (categorías de alimentos que se han convertido en productos de consumo masivo)
-Los presupuestos de marketing son limitados (operadores independientes, cadenas pequeñas)
🎯 Perspectiva del sector: Las empresas del sector de la restauración que invierten entre el 3 % y el 5 % de sus ingresos en accesorios de embalaje con marca propia logran un 231 % más de recuerdo espontáneo de la marca y un 181 % más de tasas de fidelización de los clientes en comparación con las empresas que utilizan accesorios genéricos, con un retorno de la inversión que suele ser de 4 a 7 veces superior en programas bien ejecutados durante periodos de medición de 12 meses.
Las servilletas personalizadas ofrecen una exposición de marca excepcional gracias a su frecuencia de uso (una media de entre 3 y 5 servilletas por visita de cliente) y a su visibilidad (se sostienen en las manos, se colocan sobre las mesas y aparecen en las fotos de los platos).
Opciones de impresión de servilletas:Impresión de logotipos a un color (la opción más rentable):-Un único color PMS adaptado a la identidad de marca
-Colocación del logotipo en la esquina o en el centro
-Recargo: +1 TP4T6-12 por cada mil servilletas en comparación con las sin imprimir
-Cantidad mínima de pedido: normalmente entre 50 000 y 100 000 servilletas
-Óptima visibilidad, estética limpia y profesional
Impresión en 2 colores (mejora de la imagen de marca):-Color de la marca + negro para el eslogan o la información de contacto
-Permite combinar el logotipo con un mensaje promocional
-Recargo: +1 TP4T12-18 por cada mil servilletas
-Cantidad mínima de pedido: entre 75 000 y 150 000 servilletas
-Ideal para: campañas promocionales, elementos con varios mensajes
Impresión a todo color (máximo impacto):-Logotipos complejos, imágenes fotográficas, diseños llamativos
-Máximo impacto visual y mayor recuerdo de la marca
-Recargo: +1 TP4T18-28 por cada mil servilletas
-Cantidad mínima de pedido: entre 100 000 y 200 000 servilletas
-Ideal para: marcas de lujo, eventos conmemorativos, campañas de gran envergadura
Enfoques estratégicos de creación de marca en servilletas:Clientes al día: 300 Servilletas por cliente: 3,5 Consumo anual de servilletas: 300 × 3,5 × 365 = 383 250 servilletas
Coste de las servilletas sin imprimir: 383 250 × $0,012 = $4 599 Impresión personalizada a un color: 383 250 × $0,020 = $7 665 Prima anual: $3 066
Impresiones generadas: 383 250 servilletas × 3,5 impresiones = 1 341 375 impresiones Coste por impresión: $3.066 ÷ 1.341.375 = $0,0023 (0,23 céntimos por impresión)
frente a la publicidad digital: coste por impresión típico de $0,50-2,00 Eficiencia comparativa: entre 217 y 870 veces más rentable que los anuncios digitales
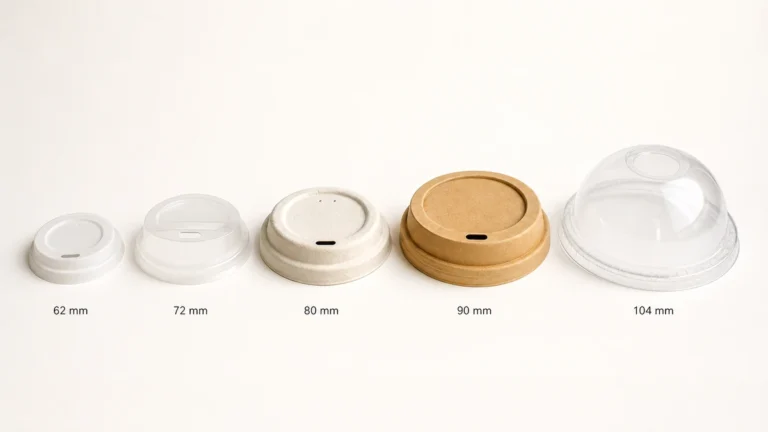
Las fundas para tazas de café y té ocupan un lugar privilegiado para la marca: envuelven las tazas que se sostienen a la altura de los ojos, son visibles para todos los clientes que se encuentran cerca y aparecen de forma destacada en las fotos de bebidas que se comparten en las redes sociales.
Opciones de personalización de las fundas:Fundas de cartón ondulado estándar:-Soportes de papel Kraft marrón o blanco
-Impresión flexográfica de 1 a 4 colores
-Diseño envolvente completo (oportunidad de promoción de marca en 360 grados)
-Precio: 1,025-1,045 TP por funda (impresas, pedidos al por mayor)
-Plazo de entrega: de 4 a 6 semanas para la impresión personalizada
Ventajas:-Amplia superficie para el logotipo (10-12 cm de ancho × 6-7 cm de alto cuando está plano)
-Gran visibilidad cuando se sostiene el vaso
-El aislamiento natural mantiene la temperatura de la bebida
-Interacción táctil (los clientes tocan y manipulan físicamente el producto)
Buenas prácticas de diseño:-Panel frontal (lo más visible): logotipo principal, nombre de la marca
-Lados envolventes: Mensajes promocionales, perfiles en redes sociales, material creativo de la campaña
-Panel interior (se ve al quitar la funda): Mensaje oculto, información sobre el programa de fidelización, código QR
Estrategias promocionales para fundas:-Formas originales que van más allá del rectángulo estándar (siluetas de marca, ventanas, recortes)
-Percepción de marca de alta gama
-Precio: entre 1,055 y 1,085 TP por paquete
-Cantidades mínimas: normalmente entre 100 000 y 250 000 unidades
-Ideal para: operaciones de alto nivel, posicionamiento de gama alta
Fundas recicladas/sostenibles:-Papel con contenido reciclado 100% o certificado por el FSC
-Refuerzo de los mensajes medioambientales
-Precio: entre 0,030 y 0,050 TP4T por paquete
-La creciente preferencia de los clientes (el 68,1 % está dispuesto a pagar un sobreprecio por opciones sostenibles)
-Ideal para: marcas con conciencia ecológica, conceptos centrados en la sostenibilidad
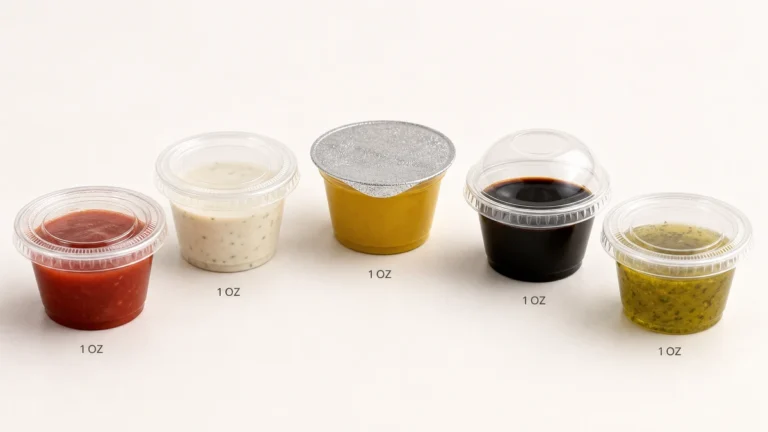
Las etiquetas adhesivas personalizadas cumplen múltiples funciones —sellar envases de comida para llevar, servir como indicadoras de manipulación, mostrar información nutricional y promocionar el mensaje de la marca— a un coste unitario excepcionalmente bajo.
Aplicaciones de las pegatinas:Etiquetas adhesivas para precintar contenedores (círculos u óvalos de 5-7,5 cm de diámetro):-Tapas con cierre seguro para envases de comida para llevar
-Incluir un sistema de seguridad contra manipulaciones en los albaranes de entrega
-Mostrar el logotipo + el mensaje “Sellado para su seguridad”
-Precio: 1 TP4T0,01-0,03 por pegatina
-Gran visibilidad en cada pedido para llevar
Etiquetas para bolsas (Rectángulos de 5 × 7,5 a 7,5 × 10 cm):-Cerrar “>bolsas de papel con cierre de marca
-Mostrar los datos de los pedidos o los nombres de los clientes
-Incluye mensajes promocionales o códigos QR
-Precio: 1 TP4T 0,015-0,035 por etiqueta
-Ideal para negocios que se dedican principalmente a la entrega a domicilio y la comida para llevar
Pegatinas promocionales (de diversos tamaños y formas):-Artículos de regalo (los clientes pueden solicitar ordenadores portátiles, botellas de agua o coches)
-Recuerdos y artículos promocionales del evento
-Colocación de marketing de guerrilla
-Precio: 1,40-1,50 € por pegatina de vinilo de calidad
-Mayor visibilidad de la marca más allá de la transacción (duración de la pegatina: de 1 a 5 años)
Integración de códigos QR:Las pegatinas son un soporte ideal para los códigos QR, ya que fomentan la participación digital:
Aplicaciones de los códigos QR:-Acceso al menú (especialmente para sistemas de pedido basados en códigos QR)
-Inscripción en el programa de fidelización
-Encuestas de satisfacción del cliente
-Enlaces a perfiles en redes sociales
-Mensajes para descargar la aplicación
-Participación en un concurso o sorteo
Rendimiento típico de los códigos QR (según los parámetros de referencia del sector):-Frecuencia de escaneo: entre 8 y 151 clientes escanean códigos en los envases cada tres horas
-Tasa de conversión: entre el 35 % y el 50 % de los escáneres completan la acción deseada
-Eficacia global: entre el 2,8 % y el 7,51 % de los clientes realizan acciones digitales a través de los códigos QR del embalaje
Aunque son más caros por unidad que las servilletas o las pegatinas, los cubiertos y las pajitas personalizados transmiten una imagen de marca de alta calidad y demuestran atención al detalle.
Cubiertos de madera o bambú con logotipo:-Logotipos grabados con láser o impresos en los mangos
-Alternativa sostenible al plástico
-Imagen de marca de alta gama (a menudo asociada a marcas respetuosas con el medio ambiente y centradas en la calidad)
-Precio: 1 TP4T0,08-0,18 por juego de cubiertos (tenedor, cuchillo y cuchara)
-Ideal para: conceptos de restauración rápida informal y de alta gama
Pajitas de papel con marca:-Impresión a todo color sobre la superficie de la pajita
-Sustituye a las pajitas de plástico prohibidas y refuerza la imagen de marca
-La necesidad funcional se convierte en una oportunidad de marketing
-Precio: 1 TP4T 0,03-0,06 por pajita (impresión personalizada)
-Gran visibilidad al consumir la bebida
Cubiertos reutilizables con la marca (artículos promocionales):-Utensilios de metal o plástico resistente con el logotipo grabado
-Mayor coste, pero mayor vida útil (los clientes los conservan y los reutilizan)
-Posicionamiento de marca sostenible
-Precio: 1 TP 4 T 1,50-4,00 por juego de cubiertos
-Ideal para: recompensas de programas de fidelización, productos de alta gama, campañas medioambientales
Calcule los costes totales, incluyendo el diseño, la configuración y la producción:
Costes de diseño (puntual o periódico):-Diseño o mejora profesional de logotipos: 1 000-2 500
-Diseño gráfico del embalaje: $300-1.200 por tipo de accesorio
-Amortizar a lo largo del período de uso previsto (normalmente entre 12 y 24 meses)
Configuración/Herramientas (una sola vez por diseño):-Planchas de impresión para flexografía: $150-400 por color
-Herramientas de troquelado para formas personalizadas: $800-2.500
-Amortizar en la primera tirada de producción
Costes de producción (recurrente):-Costes unitarios en función de la cantidad y la complejidad de la personalización
-Transporte y entrega
Ejemplo de inversión (Cafetería que ha encargado 200 000 servilletas personalizadas):Diseño gráfico: $600 (amortizado en 12 meses) Preparación de planchas de impresión: $250 (1 color, una sola vez) Servilletas (200 000 a $0,019 por servilleta): $3 800 Transporte: $180 Total del primer pedido: $4 830
Repetir pedido (mismo diseño): $3.980 (sin gastos de diseño ni de placa) Coste mensual (suponiendo un uso de 12 meses): $403 al mes el primer año, $332 al mes a partir de entonces
Paso 2: Calcular las impresiones generadasCalcular la exposición de la marca en función de los patrones de uso:
Factores multiplicadores de impresiones:-Usuario directo: 1 impresión por artículo utilizado
-Clientes cercanos (en la cola, mesas contiguas): +1-2 impresiones por artículo
-Compartir en redes sociales: entre 50 y 500 impresiones por artículo fotografiado (varía en función del número de seguidores)
-Recordatorio físico (servilleta en el bolsillo, bolsa reutilizada): +1-5 impresiones
Cálculo conservador (Cafetería, 200 000 servilletas en 12 meses):Servilletas utilizadas: 200 000 Impresiones por servilleta: 3,5 (cliente + 1-2 personas cercanas + 0,5 factor social/recordatorio) Impresiones totales: 700 000 impresiones al año
Coste por impresión: 1 483,00 ÷ 700 000 = 0,0069 (0,69 céntimos por impresión)
Paso 3: Comparar con otros canales de marketingCompara el gasto en accesorios de embalaje con otros gastos de marketing:
Calcular el impacto en el negocio derivado de una mayor notoriedad de marca y una mayor implicación de los clientes:
Enfoques de atribución:1.Atribución de la encuesta a los clientes: Pregunta a los clientes: “¿Cómo nos has conocido?”. Realiza un seguimiento de las menciones de % en los envases de la marca
2.Seguimiento de redes sociales: Supervisar los hashtags de la marca y las menciones con @, y analizar la correlación con el crecimiento del número de seguidores
3.Inscripción en el programa de fidelización: Realiza un seguimiento de los escaneos de códigos QR o del canje de códigos promocionales desde el envase
4.Análisis de visitas repetidas: Comparar las tasas de devolución de los clientes que reciben embalajes de marca frente a los genéricos
Ejemplo de atribución de ingresos (Cafetería, programa de servilletas y fundas con la marca):Clientes anuales: 109 500 (300 al día × 365 días) Inversión en accesorios de marca: 1 480 000 al año (servilletas + fundas)
Impacto en las redes sociales:
-Aumento de seguidores en Instagram: +1 240 seguidores (aumento de 281 en tres días)
-Ingresos atribuibles al tráfico de redes sociales: $4.800 (según el seguimiento de las herramientas de análisis)
Repercusión de la inscripción en el programa de fidelización:
-Escaneos de códigos QR en las fundas: 3.280 escaneos (31 clientes TP3T)
-Inscripciones en el programa de fidelización: 1.640 (conversión de 50%)
-Valor de por vida por miembro del programa de fidelización: $340
-LTV atribuible: $557 600 (a lo largo de varios años)
Repercusión de las visitas de seguimiento:
-Mejora estimada del 41 % en la tasa de visitas de seguimiento (datos de la encuesta)
-4.380 visitas adicionales al año
-Precio medio de la entrada: 1,4850
-Ingresos adicionales: $37 230 al año
Impacto cuantificable total durante el primer año: $42 030 Rentabilidad de la inversión (ROI): ($42 030 – $8 200) ÷ $8 200 = 4 12% de ROI
Rango conservador del retorno de la inversión: La mayoría de los programas de branding de envases bien ejecutados generan un retorno de la inversión de entre el 200 % y el 600 % en el primer año, y este porcentaje mejora en los años siguientes a medida que se amortizan los costes de diseño y se acumula el valor del ciclo de vida del cliente.
Aprovecha los accesorios de marca para fomentar la participación en las redes sociales y el contenido generado por los usuarios:
Mecánica de la campaña:1.Diseña accesorios de marca dignos de ser fotografiados: Colores llamativos, textos ingeniosos y diseños distintivos que los clientes quieren fotografiar
2.Incluye una llamada a la acción clara sobre los accesorios: “Comparte tu momento con el hashtag ##BrandHashtag y podrás ganar [premio]”
3.Promocionar la campaña en todos los canales: Carteles en la tienda, publicaciones en redes sociales, correos electrónicos, menciones del personal
4.Supervisar e interactuar: Realiza un seguimiento del uso de los hashtags, comenta las publicaciones de los clientes y destaca el mejor contenido
5.Recompensar la participación: Premios semanales y mensuales a las mejores fotos — sorteos aleatorios, ofertas exclusivas
Ejemplo de campaña: Campaña «Morning Vibes» de la cafetería especializada #Elementos de marca:-Fundas para tazas personalizadas con el diseño “#MorningVibes” escrito a mano y el lema “Comparte tu momento perfecto con el café de la mañana”
-Servilletas a juego con la misma estética
-Carteles de mesa en los que se explican las bases del concurso
Incentivos:-Premio semanal: café gratis durante un mes (valor $120)
-Gran premio mensual: Cata privada de café para 10 amigos (valor de $350)
-Todos los participantes: 10% de descuento en la próxima visita (cupón digital enviado por mensaje directo)
Resultados (campaña de 8 semanas):-487 publicaciones en Instagram con la etiqueta ##MorningVibes
-3.280 «Me gusta», comentarios y compartidos en total (una media de 6,7 por publicación)
-890 nuevos seguidores en Instagram (un aumento de 341 durante la campaña)
-Alcance estimado: 147 000 impresiones (según el análisis de seguidores)
-Coste de la campaña: 1 TP 4 T 1 240 (fundas y servilletas personalizadas + premios)
-Coste por impresión: $0,0084
-Coste por nuevo seguidor: 1,39 € (en comparación con el $3-8 habitual en la adquisición de seguidores de pago)
Utiliza accesorios de embalaje para fomentar la inscripción en el programa de fidelización y la participación:
Tácticas:Inscripción mediante código QR:-Imprime códigos QR en servilletas, fundas o pegatinas que dirijan directamente a la descarga de la aplicación de fidelización o al registro en la web
-Ofrece un incentivo inmediato: “Escanea el código para registrarte y llévate hoy mismo [artículo] gratis”
-Realiza un seguimiento de las tasas de visualización y la conversión mediante códigos QR únicos
Rendimiento típico:-Índice de escaneo de códigos QR: entre 8 y 151 clientes
-Conversión de registros: 40-60% de escáneres
-Número total de suscriptores: 3,2-9% de clientes a través de mensajes en los envases
Alternativas a las tarjetas perforadas:-Imprimir las instrucciones de la tarjeta perforada digital en los accesorios
-“Descarga nuestra aplicación y empieza a ganar recompensas”
-Pasar a los clientes de las tarjetas perforadas físicas al seguimiento digital
Ofertas exclusivas:-Ofertas por tiempo limitado que solo aparecen en el envase
-“Los miembros del programa de fidelidad disfrutan esta semana de un descuento de 20% en las bebidas de temporada. ¡Únete ahora!”
-Genera un sentido de urgencia y pone de manifiesto las ventajas para los socios
Programa de ejemplo: Lanzamiento del programa de fidelización de un restaurante de comida rápida informalPreestreno (embalaje genérico):-Miembros del programa de fidelización: 1.240 (el 81 % de la cartera de clientes)
-Tasa de inscripción semanal: entre 18 y 25 nuevos miembros
Tras el lanzamiento (servilletas con el logotipo de la marca y código QR, pegatinas para bolsas con un mensaje para descargar la aplicación):-Campaña de seis semanas
-Tasa de inscripción semanal: 87-104 nuevos miembros (aumento de 380%)
-Total de nuevas matriculaciones: 558
-Inversión en embalajes de campaña: $920
-Coste por adquisición: $1,65 (en comparación con el $8-15 habitual en la adquisición de pago)
Aprovecha los accesorios de embalaje para campañas en las que el tiempo es un factor clave:
Lanzamiento de menús de temporada:-Accesorios personalizados con motivos de temporada
-Diseños con temática navideña que crean un ambiente festivo
-“Prueba nuestro nuevo [producto de temporada]”, con imágenes del producto
Ofertas flash y descuentos:-“Muestra esta servilleta para obtener un descuento de 151 TP3T en tu próxima visita esta semana”
-Crea un cupón físico que fomenta las visitas repetidas
-Fácil seguimiento gracias a la recogida de servilletas en el momento del canje
Promoción de eventos:-Anuncia los próximos eventos (música en directo, menús degustación, reuniones comunitarias)
-Genera expectación con varias semanas de antelación a través de los contactos diarios con los clientes
-Incluye instrucciones para confirmar la asistencia o enlaces para comprar entradas
Ejemplo de campaña: Promoción de la Oktoberfest de la cerveceríaAccesorios:-Posavasos personalizados con información sobre el evento del Oktoberfest (fechas, menú especial, música en directo)
-Servilletas con diseños de cervezas de edición limitada
-Pegatinas con el hashtag del evento para compartir en redes sociales
Distribución:-Desde cuatro semanas antes del evento hasta la fecha del evento
-Todos los pedidos de cerveza de barril incluyen un posavasos con la marca
-Se han repartido 45 000 posavasos
Resultados:-Asistencia al evento: 1.240 clientes (año anterior: 780, un aumento de 591)
-Uso de hashtags en las redes sociales: 340 publicaciones
-Datos de la encuesta: 671 de los asistentes mencionaron los posavasos como fuente de información
-Referencia del accesorio: $680
-Ingresos incrementales por eventos: $18 700 (frente al año anterior)
-ROI: 2,650%
Utiliza accesorios de marca para promover colaboraciones empresariales complementarias:
Oportunidades de marca compartida:-Cafetería + panadería: “Acompaña tu café con bollería recién hecha de [Panadería colaboradora]”
-Restaurante + entretenimiento: “Cena y espectáculo: 20% de descuento en [Teatro asociado]”
-Cafetería + tienda: “Recarga energías para tus compras: muestra esta servilleta para obtener un descuento en [Boutique]”
Implementación:-Repartir los gastos de los accesorios entre los socios
-Incluye tanto los logotipos como los mensajes de promoción cruzada
-Los códigos de oferta rastreables permiten medir la eficacia de las campañas
Colaboración con la comunidad:-Organizaciones sin ánimo de lucro locales, colegios y equipos deportivos
-“Apoyamos a [Organización]: este mes hemos donado el 101 % de las ventas”
-Fomenta la buena voluntad de la comunidad al tiempo que promueve la adhesión a la causa
Ejemplo de colaboración: Estudio de yoga + Cafetería de batidosCampaña: Colaboración de bienestar “Namaste & Nourish”Accesorios de marca:-Fundas para vasos de café de la cafetería “Smoothie” con el logotipo del estudio de yoga y el mensaje «Primera clase gratis con esta funda»
-Toallas para estudios de yoga con el logotipo de Smoothie Café y el lema “20% de descuento en un batido después del entrenamiento”
Resultados (campaña de 12 semanas):-Canje de vales de Smoothie Café en el estudio de yoga: 87 nuevos asistentes a las clases
-Canje de toallas de la escuela de yoga en la cafetería: 142 batidos comprados
-Ingresos por referencias cruzadas:
– Estudio de yoga: $2.610 (paquetes de clases vendidos a nuevos alumnos) – Cafetería de batidos: $1.065 (ventas de batidos + valor de visitas futuras)-Inversión combinada en accesorios: $840
-Rentabilidad total: 337%
-Relación duradera: 641 clientes recomendados se convirtieron en clientes habituales de la empresa asociada
-Pregunta a los clientes: “¿Qué cafeterías o restaurantes conoces en esta zona?”
-Pista %: mención de tu marca antes y después de la implementación de los accesorios de marca
-Objetivo de mejora: aumento del 15-251 % en las tasas de recuperación
Reconocimiento de marca asistido:-Muestra el logotipo y pregunta: “¿Has oído hablar de esta empresa?”.”
-Evaluar los índices de reconocimiento entre los residentes de la zona
-Objetivo: reconocimiento de 60-75% en el área comercial principal
Asociación de atributos de marca:-Encuesta: “¿Qué palabras describen [nombre de la marca]?” (calidad, sostenible, acogedora, etc.)
-Evaluar si los accesorios de marca refuerzan el posicionamiento deseado
-Realizar un seguimiento de la correspondencia entre los atributos de marca previstos y los percibidos
Métricas de captación de clientes:Seguimiento de nuevas fuentes de clientes:-Pregunta a los nuevos clientes: “¿Cómo nos has conocido?”.”
-Realizar un seguimiento de las respuestas que mencionen el embalaje de marca, las redes sociales (a menudo impulsadas por el embalaje) y el boca a boca
-Estimación de atribución: entre 8 y 151 clientes nuevos influenciados por los accesorios de marca (ya sea directamente o a través de las redes sociales o el boca a boca)
Aumento del número de seguidores en las redes sociales:-Realiza un seguimiento del número de seguidores en todas las plataformas
-Relacionar el crecimiento con campañas de accesorios de marca que incluyan perfiles en redes sociales
-Impacto habitual: aumento de seguidores de 15 a 351 durante las campañas activas
Índices de escaneo de códigos QR:-Realizar un escaneo de los códigos QR impresos en los accesorios
-Medición de la conversión desde el escaneo hasta la acción deseada (descarga de la aplicación, inscripción en el programa de fidelización, visita a la página web)
-Referencia: frecuencia de barrido de 8-151 TP3T, tasa de conversión de 35-501 TP3T
Métricas de interacción con los clientes:Interacción en las redes sociales:-Supervisar el uso de los hashtags de la marca
-Realiza un seguimiento de las menciones y las etiquetas en las publicaciones de los clientes
-Mide la interacción («Me gusta», comentarios, veces que se comparte) en el contenido generado por los usuarios
-Las campañas típicas de accesorios de marca generan entre 200 y 500 publicaciones en redes sociales por cada 10 000 clientes
Inscripción en el programa de fidelización:-Realizar un seguimiento de las inscripciones atribuidas a las indicaciones del embalaje (códigos QR, llamadas a la acción para descargar la aplicación)
-Comparar la mejora de la tasa de inscripción con respecto al valor de referencia anterior a la introducción de los accesorios de marca
-Objetivo: tasa de inscripción de 3-9% a través de los puntos de contacto de los envases
Índice de visitas repetidas:-Compara la frecuencia de las visitas de los clientes que reciben accesorios de marca con la de los que reciben accesorios genéricos
-Hipótesis: Los accesorios de marca crean un recuerdo más sólido de la marca → mayor probabilidad de que el cliente vuelva
-Método de medición: análisis de grupos de control o comparación de series temporales
Indicadores de impacto en los ingresos:Canje de la oferta promocional:-Realizar un seguimiento del canje de las ofertas impresas en los accesorios (códigos promocionales, presentación en servilletas)
-Medir la tasa de canje y los ingresos incrementales
-Redención habitual: 4-12% para ofertas bien diseñadas con carácter urgente
Eficacia de las ventas cruzadas y las ventas de productos de gama superior:-Realizar un seguimiento de las ventas de los artículos promocionados en la sección de accesorios
-Comparar las ventas durante la campaña de accesorios de marca con las de los periodos de referencia
-Evaluar el cambio en la composición del menú hacia los productos destacados
Comparación del valor del ciclo de vida del cliente (LTV):-Segmenta a los clientes según su interacción con los accesorios de la marca (escaneos de códigos QR, canje de ofertas, publicaciones en redes sociales)
-Comparar el LTV de los clientes activos frente a los no activos
-Hipótesis: los clientes comprometidos muestran una mayor fidelidad y un mayor valor a lo largo de su relación con la empresa
Compara diferentes mensajes promocionales para identificar las llamadas a la acción más eficaces:
Configuración de la prueba:-Variante A: “Síguenos en Instagram en @BrandName”
-Variante B: “Comparte tu momento café con #BrandName y entra en el sorteo”
-Variante C: “Escanea el código para conseguir café gratis el día de tu cumpleaños” (código QR para registrarse en el programa de fidelización)
Medición: Realizar un seguimiento de los índices de finalización de acciones (seguimientos, publicaciones, visualizaciones) durante un periodo de prueba de cuatro semanasHallazgos típicos:-Las llamadas a la acción basadas en incentivos (Variante C) suelen superar en rendimiento a las solicitudes pasivas entre 3 y 5 veces; la mayoría de las llamadas a la acción con premios (Variante B) generan entre un 40 % y un 70 % más de interacción que los simples «me gusta» (Variante A).
Variable de prueba 2: Estética del diseñoCompara los distintos enfoques de diseño de accesorios de marca:
Configuración de la prueba:-Variante A: Solo el logotipo, diseño limpio y minimalista
-Variante B: Logotipo + eslogan + sitio web, centrada en la información
-Variante C: Colores llamativos, ilustraciones creativas y un diseño visual optimizado para Instagram
Medición: Encuestas a clientes sobre la percepción de la marca y la frecuencia de publicaciones en redes sociales relacionadas con el embalajeHallazgos típicos:-Los diseños visuales y creativos (Variante C) generan entre dos y cuatro veces más publicaciones en redes sociales
-Los diseños con gran cantidad de información (Variante B) generan un tráfico ligeramente mayor en el sitio web
-El estilo minimalista y limpio (Variante A) obtiene la puntuación más alta en los atributos de marca “premium” y “profesional”
Aplicación estratégica: Adaptar el enfoque de diseño al objetivo principal (compromiso social frente a información frente a posicionamiento de gama alta)Variable de prueba 3: Prioridad del tipo de accesorioIdentificar los tipos de accesorios que ofrecen un mayor retorno de la inversión para la inversión en personalización:
Configuración de la prueba:-Fase 1: Solo servilletas personalizadas (4 semanas)
-Fase 2: Solo fundas personalizadas para vasos (4 semanas)
-Fase 3: Solo pegatinas personalizadas (4 semanas)
-Fase 4: Las tres combinadas (4 semanas)
Medición: Realizar un seguimiento de las encuestas sobre el conocimiento de la marca, las publicaciones en redes sociales y la atribución de nuevos clientes en todas las fasesHallazgos típicos:-Los manguitos para vasos son los que más se comparten en las redes sociales (debido a la cultura de Instagram en torno a las bebidas)
-Las servilletas generan el mayor volumen de impresiones (debido a la cantidad que se utiliza)
-Las pegatinas son lo que deja una impresión más duradera (son objetos físicos que los clientes conservan)
-El enfoque combinado genera una sinergia que supera la suma de los efectos individuales (aumento de +15-251 TP3T)
❌ Error #1: Optar por un diseño basado únicamente en el logotipo sin un mensaje estratégico
Muchas empresas invierten en accesorios personalizados, pero limitan el contenido a la mera inclusión del logotipo, dejando pasar oportunidades para incluir mensajes promocionales, llamadas a la acción o creatividades de campaña. Si bien el reconocimiento del logotipo tiene su valor, los accesorios ofrecen un espacio privilegiado para impulsar acciones concretas por parte de los clientes, como la interacción en redes sociales, la inscripción en programas de fidelización o el canje de ofertas promocionales.
Solución: Considera cada accesorio como un pequeño anuncio con un objetivo concreto. Incluye el logotipo para reforzar el reconocimiento de marca, además de contenido estratégico: perfiles en redes sociales con llamadas a la interacción, un código QR que redirija al programa de fidelización o a una oferta especial, mensajes promocionales sobre ofertas por tiempo limitado, o información sobre la historia y los valores de la marca. La jerarquía del diseño debe guiar la mirada del cliente desde el logotipo hacia el mensaje y, finalmente, hacia la llamada a la acción.Ejemplo: En lugar de una servilleta en la que solo aparezca el logotipo, incluye: logotipo + “Síguenos en @NombreDeLaMarca” + icono de Instagram + “Comparte tu comida y etiquétanos para obtener un descuento de 10% en tu próxima visita”❌ Error #2: Pedidos insuficientes debido al impacto que supone el importe mínimo
La impresión personalizada de accesorios suele exigir cantidades mínimas de pedido (a menudo 100 000 unidades), lo que supone una gran inversión inicial que desanima a los pequeños operadores. Algunas empresas realizan pedidos por debajo de los mínimos pagando un sobreprecio por unidad, o renuncian por completo a la personalización de la marca debido a las barreras de coste percibidas. Sin embargo, cuando se amortizan a lo largo de periodos de uso de entre 6 y 12 meses, los costes por cliente son bajos (a menudo entre 0,05 y 0,15 euros por cliente para un paquete completo de accesorios).
Solución: Calcula el coste mensual por cliente en lugar de centrarte en el valor total del pedido. Si 200 000 servilletas personalizadas cuestan 14 000 y se sirven a 50 000 clientes a lo largo de 10 meses, eso supone 0,08 por cliente, menos de un tercio del ticket medio. Considere los pedidos compartidos con múltiples ubicaciones (operadores de cadenas) o los contratos anuales con entregas periódicas para alcanzar los mínimos y, al mismo tiempo, distribuir el impacto en el flujo de caja.Marco presupuestario: Destina entre 2 000 y 4 000 euros de los ingresos mensuales a programas de accesorios de marca. Para una empresa con unos ingresos mensuales de 100 000 euros, eso supone entre 1 000 y 2 000 euros al mes destinados a financiar la personalización integral de los accesorios.❌ Error #3: No realizar un seguimiento del ROI y de los resultados atribuibles
Las empresas ponen en marcha programas de accesorios de marca, pero no miden su impacto mediante encuestas a los clientes, el seguimiento de códigos QR, la monitorización de las redes sociales o la atribución de la fidelidad. Sin datos sobre el rendimiento, no es posible optimizar los programas ni demostrar el retorno de la inversión para justificar la continuidad de la inversión.
Solución: Establecer un marco de evaluación antes de poner en marcha el programa:1.Indicadores de referencia: Evalúa el grado de reconocimiento actual de la marca, las tasas de crecimiento en las redes sociales y las fuentes de nuevos clientes ANTES de lanzar accesorios de marca
2.Mecanismos de seguimiento: Implementa códigos QR con funciones de análisis, crea códigos promocionales únicos para ofertas de accesorios y añade el campo “¿Cómo nos has conocido?” en el punto de venta o en el registro del programa de fidelización
3.Seguimiento social: Configura alertas para hashtags de marca y menciones con @, y analiza la correlación entre el crecimiento del número de seguidores y las campañas de accesorios
4.Revisión periódica: Cuadro de mando mensual con análisis de los indicadores clave de rendimiento (crecimiento en redes sociales, escaneos de códigos QR, canje de promociones, atribución de la procedencia de los clientes)
5.Ciclos de optimización: Pruebas A/B trimestrales sobre los mensajes, el diseño o los tipos de accesorios, basadas en datos de rendimiento
Incluso una simple encuesta (en la que se pregunta a los clientes: “¿Se ha fijado en nuestras servilletas o fundas con la marca?”, y se hace un seguimiento de los que responden «sí» según el método %) ofrece información valiosa.
❌ Error #4: falta de coherencia en la imagen de marca entre los distintos tipos de accesorios
Algunas empresas personalizan las servilletas pero utilizan fundas genéricas, o imprimen pegatinas con combinaciones de colores diferentes a las de los vasos, lo que da lugar a una experiencia de marca inconexa. La falta de coherencia reduce el impacto global de la marca y da la impresión de que no se presta atención a los detalles.
Solución: Desarrollar un sistema integral de marca para los accesorios con una identidad visual coherente:1.Directrices de diseño: Establecer la paleta de colores (colores PMS para garantizar la uniformidad en la impresión), las normas de uso del logotipo, la tipografía y los elementos gráficos que se utilizarán en todos los accesorios
2.Implantación coordinada: Lanzar los accesorios personalizados como un sistema completo, en lugar de hacerlo de forma fragmentada (o por fases coordinadas)
3.Coordinación de proveedores: Colaborar con los proveedores que ofrecen diversos tipos de accesorios para garantizar la coincidencia de colores y la coherencia en el diseño
4.Manual de marca: Elabora una guía de referencia sencilla que muestre cómo aparecen el logotipo y los elementos de marca en cada tipo de accesorio
Un sistema coordinado transmite una imagen profesional y refuerza la identidad de marca mediante la repetición en todos los puntos de contacto.
El retorno de la inversión varía según el tipo de negocio y los objetivos, pero hay tres categorías de accesorios que siempre ofrecen los mejores resultados:
Servilletas personalizadas (Ideal para: exposición de marca basada en el volumen):¿Por qué un alto retorno de la inversión?:-Un mayor consumo (entre 3 y 5 servilletas por cliente) genera un volumen máximo de impresiones
-Coste por impresión más bajo (normalmente entre 0,002 y 0,005)
-Aplicación universal en todo tipo de establecimientos de restauración
-Presente en la fotografía gastronómica y en las redes sociales
Rentabilidad de la inversión habitual: 300-500% el primer año, con una mejora en los años siguientes a medida que se amortizan los costes de diseñoLo mejor para: Todos los establecimientos de restauración, especialmente aquellos que ofrecen servicio de comedor o que registran un gran volumen de pedidos para llevar, donde el consumo de servilletas es elevadoFundas personalizadas para vasos (Ideal para: interacción en redes sociales y posicionamiento de alta gama):¿Por qué un alto retorno de la inversión?:-Óptima visibilidad cuando las bebidas se colocan a la altura de los ojos
-Gran potencial para compartir en redes sociales (las fotos de bebidas son habituales en Instagram)
-Tiempo de atención al cliente prolongado (10-20 minutos)
-Imagen de marca de alta gama (las fundas personalizadas denotan atención al detalle)
Rentabilidad de la inversión habitual: 250-450% primer año, con excelentes resultados en los indicadores clave de rendimiento (KPI) de las redes socialesLo mejor para: Cafeterías, locales de café, conceptos centrados en bebidas, negocios dirigidos a un público activo en InstagramEtiquetas y pegatinas personalizadas (Ideal para: programas de fidelización y operaciones de reparto):¿Por qué un alto retorno de la inversión?:-El menor coste unitario ($0,01-0,03) sin renunciar a una alta visibilidad
-Imprescindible para entregas a domicilio o comida para llevar (precintado, sellado de bolsas)
-La integración de códigos QR impulsa acciones digitales cuantificables
-Las pegatinas promocionales prolongan la vida útil de la marca más allá de la transacción
Rentabilidad de la inversión habitual: 200-400% primer año, con un rendimiento especialmente destacado en la inscripción en programas de fidelización mediante códigos QRLo mejor para: Empresas centradas en la entrega a domicilio, cocinas fantasma, operadores de programas de fidelización y negocios con presupuestos reducidos que necesitan un punto de partida rentableRecomendación estratégica: Para las empresas que se inician en el branding de accesorios, empieza por el tipo de accesorio que más se utilice en tu negocio:-Especializado en bebidas → Fundas para vasos
-Restaurante con servicio en el local → Servilletas
-Con gran volumen de envíos → Pegatinas/etiquetas
-Comida para llevar → Servilletas + pegatinas
Una vez que el primer tipo de accesorio demuestre su retorno de la inversión, amplíe la iniciativa a un sistema integral que abarque todos los puntos de contacto. Este enfoque combinado genera un efecto sinérgico de entre un 15 % y un 25 % superior a la suma de los impactos individuales de cada accesorio.
Las cantidades mínimas de pedido (MOQ) varían considerablemente según el tipo de accesorio, el método de impresión y el proveedor, pero conocer los rangos habituales permite planificar con realismo:
Servilletas (Impresión flexográfica):-Cantidad mínima de pedido estándar: entre 50 000 y 100 000 servilletas
-Cronología de uso: entre 3 y 6 meses para una cafetería pequeña, entre 1 y 2 meses para un restaurante con mucha afluencia
-Rango de precios: 1.000-2.000 unidades para el pedido mínimo (impresión en 1-2 colores)
-Estrategia: Adecuado para la mayoría de los negocios pequeños y medianos. Los negocios muy pequeños (<50 clientes al día) pueden necesitar más de 12 meses para agotar las cantidades mínimas.
Mangas de copa:-Cantidad mínima de pedido estándar: entre 10 000 y 25 000 fundas
-Cronología de uso: entre 2 y 4 meses para una cafetería muy concurrida
-Rango de precios: $300-$900 para el pedido mínimo (impresión en 1-2 colores)
-Estrategia: Más asequible para negocios pequeños que las servilletas. Considera la posibilidad de pedir un suministro para seis meses a fin de alcanzar los pedidos mínimos.
Pegatinas/Etiquetas:-Cantidad mínima de pedido estándar: entre 5 000 y 10 000 pegatinas (varía considerablemente según el tamaño y la complejidad)
-Cronología de uso: entre 1 y 3 meses para un servicio activo de comida para llevar y a domicilio
-Rango de precios: $150-$500 para el pedido mínimo
-Estrategia: La barrera de entrada más baja. Un excelente punto de partida para probar la estrategia de marca de los accesorios.
Pajitas de papel (impresión personalizada):-Cantidad mínima de pedido estándar: entre 25 000 y 50 000 pajitas
-Cronología de uso: entre 2 y 5 meses para un negocio dedicado a las bebidas
-Rango de precios: 1 TP4T750-1 TP4T2.500 para el pedido mínimo
-Estrategia: Un pedido mínimo elevado limita el acceso de los pequeños operadores. Considéralo únicamente para operaciones de volumen medio a alto.
Impresión digital (Alternativa para pedidos mínimos más reducidos):Algunos proveedores ofrecen impresión digital con cantidades mínimas más bajas, pero con un coste unitario más elevado:
-Servilletas: Pedido mínimo de 10 000 a 25 000 unidades (coste unitario superior para cantidades de 50 a 751 unidades)
-Mangas: Pedido mínimo de 2.500-5.000 unidades (coste unitario superior de 40-601 TP3T)
-Lo mejor para: Probar los diseños antes de asumir compromisos más importantes, operaciones a pequeña escala, cambios frecuentes en el diseño
Estrategias para cumplir los requisitos mínimos:1.Pedidos con varias ubicaciones: Las cadenas o franquicias pueden repartir los importes mínimos entre sus distintos establecimientos
2.Planificación anual: Pide un suministro para 12 meses de una sola vez y aprovecha los precios por volumen
3.Diseños compartidos: Varias unidades de negocio (camiones de comida + división de catering) utilizan el mismo diseño en todas sus operaciones
4.Implantación por fases: Empieza con pegatinas (pedido mínimo más bajo), añade fundas una vez que se haya demostrado el retorno de la inversión y, después, servilletas
5.Negociación con proveedores: Algunos proveedores reducen los pedidos mínimos para los nuevos clientes o durante los periodos promocionales
Consideraciones sobre el almacenamiento:Comprueba que dispones de espacio de almacenamiento suficiente antes de realizar pedidos de grandes cantidades:
-50 000 servilletas (pedido mínimo habitual): ~8-12 pies cúbicos de espacio de almacenamiento
-25 000 fundas: ~4-6 pies cúbicos
-10 000 pegatinas: Mínimo (<1 pie cúbico)
La mayoría de las pequeñas empresas pueden almacenar los pedidos mínimos habituales en un armario de almacenamiento estándar, pero conviene verificarlo antes de comprometerse.
Los plazos de entrega varían en función de la complejidad de la personalización y del proveedor, pero los plazos de planificación suelen oscilar entre 4 y 8 semanas desde la concepción hasta la entrega; en la mayoría de los casos: 1: Desarrollo del diseño** (1-2 semanas):
Actividades:-Informar al diseñador sobre la identidad de marca, los objetivos y el mensaje
-El diseñador elabora los conceptos iniciales y las maquetas
-Ciclos de revisión y corrección (normalmente de 1 a 3 rondas)
-Aprobación definitiva del diseño
factores habituales**:-Colocación sencilla del logotipo: de 3 a 5 días laborables
-Diseño personalizado con texto y gráficos: 1-2 semanas
-Aprobaciones de varias partes interesadas: añadir entre 3 y 7 días
Consejo: Prepara con antelación los recursos de marca (archivos del logotipo en alta resolución, directrices de marca, mensajes aprobados) para agilizar la fase de diseñoFase 2: Configuración de proveedores y comprobación (1-2 semanas):Actividades:-El proveedor prepara las planchas de impresión (flexográficas) o los archivos digitales
-Maqueta digital que muestra cómo quedará el diseño en el producto real
-Fabricación de muestras físicas (para impresión flexográfica)
-Aprobación de la prueba
Factores temporales:-Impresión digital: 3-5 días (no se necesitan planchas)
-Impresión flexográfica: 7-14 días (creación de planchas + muestra física)
-Troquelado personalizado o materiales especiales: añadir entre 5 y 10 días
Retrasos habituales: Solicitudes de revisión de pruebas (prever un margen de tiempo), iteraciones de ajuste de color, troqueles para formas personalizadasFase 3: Producción (1-3 semanas):Actividades:-Tirada
-Inspección de control de calidad
-Embalaje para el envío
Factores temporales:-Cantidades pequeñas (con pedido mínimo): 5-10 días
-Grandes cantidades (más de 200 000 unidades): 2-3 semanas
-Algunos proveedores ofrecen la opción de producción urgente (con un sobrecoste de 20-30 % y una reducción del plazo de entrega del 40-50 %)
Fase 4: Envío (3-7 días):Actividades:-Transporte terrestre (nacional)
-Entrega en el lugar
Factores temporales:-Envío terrestre nacional: normalmente entre 3 y 5 días
-Lugares remotos: 5-7 días
-Envíos internacionales: 2-4 semanas (más el tiempo de fabricación en el extranjero)
Resumen general del calendario:-Primeros pedidos: El plazo de entrega para la impresión flexográfica (la más habitual) es de entre 8 y 10 semanas, desde la fase de diseño hasta la entrega.
-Reposiciones (mismo diseño): 2-3 semanas (sin fases de diseño ni de revisión)
-Ofertas de temporada y para eventos: Empieza a planificar con 12-14 semanas de antelación para poder realizar revisiones del diseño y tener en cuenta posibles retrasos
-Rush necesita: Impresión digital con un plazo total de 3-4 semanas, pero se acepta un recargo en el coste de 40-60%
Cómo evitar retrasos:1.Facilite las especificaciones completas del material gráfico desde el principio (formatos de archivo, códigos de color, texto exacto)
2.Aprobar las pruebas rápidamente (aprobación el mismo día o al día siguiente frente a retrasos de varios días)
3.Realiza tu pedido fuera de temporada alta (evita los periodos de mayor afluencia de noviembre a diciembre)
4.Comunicar las limitaciones de tiempo al proveedor (fechas de los eventos, plazos para la inauguración)
5.Prever un margen de tiempo (Nunca planifiques basándote en el plazo mínimo; deja un margen de 20 a 30 días).
Los accesorios de embalaje personalizados son una opción totalmente viable para las pequeñas empresas que adoptan estrategias destinadas a optimizar el impacto en el presupuesto:
Estrategias económicas:1. Empieza con un solo tipo de accesorioEn lugar de un programa global que abarque todos los accesorios, centra la inversión en los artículos de mayor impacto:
Ejemplo: Pequeña cafetería (100 clientes al día)-Presupuesto: 1 450-800 para la personalización inicial de los accesorios
-Enfoque recomendado: solo fundas personalizadas para vasos
– 10 000 fundas a 1 TP 4 T 0,035 cada una = 1 TP 4 T 350 – Costes de diseño: 1 TP 4 T 300-400 – Total: 1 TP 4 T 650-750-Plazo de entrega: suministro para 3-4 meses
-Coste mensual: $163-188
-Como 1 % de los ingresos (suponiendo un ticket medio de $8 × 3.000 clientes al mes = $24.000 de ingresos): 0,68-0,78%
Una vez que las fundas demuestren su utilidad (crecimiento en las redes sociales, opiniones de los clientes, reconocimiento de marca), amplía la gama a servilletas o pegatinas.
2. Aprovecha la impresión digital para reducir los pedidos mínimosLa impresión digital permite producir tiradas más pequeñas con un coste unitario más elevado, pero con una inversión total menor:
Comparación (Servilletas):Flexografía tradicional:
-Cantidad mínima de pedido: 50 000 servilletas
-Precio: 1 400 TP (0,036 TP por servilleta)
-Tiempo de uso: 10 meses (pequeña cafetería)
-Inversión inicial: $1.800
Impresión digital:
-Cantidad mínima de pedido: 10 000 servilletas
-Precio: 1,465 TP (0,065 TP por servilleta)
-Duración: 2 meses
-Inversión inicial: $650
Para las pequeñas empresas, puede resultar más conveniente una inversión inicial menor ($650 frente a $1.800), a pesar de que los costes unitarios sean más elevados, sobre todo a la hora de realizar pruebas antes de asumir compromisos más importantes.
3. Centrarse en las pegatinas como punto de entrada más económicoLas pegatinas ofrecen los pedidos mínimos más reducidos y la inversión total más baja:
Programa de inicio económico:-10 000 pegatinas personalizadas (5-7,5 cm, 1-2 colores) a 1,04 TWD cada una = 1 042,50 TWD
-Costes de diseño: $200-300
-Inversión total: $450-550
-Duración: 2-4 meses (para sellar bolsas de comida para llevar y recipientes)
-Extremadamente asequible incluso para las empresas más pequeñas
Las pegatinas aportan una visibilidad inmediata de la marca en cada pedido para llevar, al tiempo que permiten evaluar la reacción de los clientes ante los accesorios de la marca.
4. Perspectiva de amortización anualReplantearse la inversión única como una asignación del presupuesto anual de marketing:
Ejemplo: Un restaurante ha encargado 1.430 servilletas personalizadas (suministro para 12 meses)Coste mensual: 1 425 000 TP al mes Como 1 300 TP de ingresos (suponiendo unos ingresos mensuales de 1 440 000 TP): 0,6251 300 TP
Comparación con otras estrategias de marketing:-Publicidad digital: ingresos habituales de entre el 3 % y el 51 %
-Publicidad impresa: 2-4% de ingresos
-Mix de marketing tradicional: 5-10% del total de ingresos
Los accesorios de embalaje, que suponen entre el 0,5 % y el 11 % de los ingresos, tienen un impacto mínimo en el presupuesto y ofrecen un excelente retorno de la inversión.
5. Pedidos compartidos y enfoques cooperativosLas pequeñas empresas pueden agrupar pedidos para alcanzar los mínimos:
Ejemplo: Tres food trucks que comparten una cocina central-Cada una opera de forma independiente con marcas distintas
-Cada uno necesita servilletas personalizadas, pero no alcanza el pedido mínimo de 50 000 unidades por separado
-Solución: Pedir junto con tres diseños distintos impresos en la misma tirada
-Supplfrequently suele aceptar mínimos fraccionados (20 000 unidades por marca × 3 marcas)
-Los costes compartidos de diseño y envío reducen la inversión por empresa
Un enfoque similar funciona para:
-Espacios gastronómicos con varios locales (pedidos compartidos de cocina central)
-Propietarios de franquicias (distribución de pedidos entre distintos establecimientos)
-Empresas de catering (diferentes líneas de eventos que comparten pedidos)
Guía recomendada para pequeñas empresas:Fase 1 (Meses 1-3): Solo pegatinas-Inversión: $400-600
-Probar el concepto de marca y recabar opiniones de los clientes
Fase 2 (Meses 4-9): Añade fundas para vasos o servilletas (lo que suponga un mayor volumen para tu negocio)-Inversión: $600-1.200
-Ampliar la presencia de la marca y empezar a medir el impacto en las redes sociales
Fase 3 (Meses 10-18): Programa integral que abarca todos los accesorios-Inversión: 1 TP4T, entre 2 000 y 3 500 al año
-Un sistema de marca consolidado con un retorno de la inversión demostrado
Inversión total durante el primer año: $, entre 2 000 y 3 500 repartidos en las distintas fases Gama asequible típica para pequeñas empresas: $150-300 al mes de presupuesto de marketingConclusión: Los accesorios de embalaje personalizados están al alcance de las pequeñas empresas con presupuestos de tan solo 1 400-600 TPL para los programas iniciales, que se amplían en función del retorno de la inversión demostrado. Una implementación por fases estratégica y el enfoque en accesorios de gran impacto permiten crear una imagen de marca profesional sin costes prohibitivos.Los códigos QR en los accesorios de los envases tienden un puente entre la experiencia física y la digital del cliente, lo que genera acciones cuantificables como la inscripción en programas de fidelización, el seguimiento en redes sociales y la participación en promociones. Para una implementación eficaz, es necesario una ubicación estratégica, propuestas de valor atractivas y llamadas a la acción claras:
Buenas prácticas para el uso de códigos QR:1. Ofrecer una propuesta de valor claraLos clientes necesitan una razón de peso para escanear: el mensaje genérico “escanea para saber más” no da tan buenos resultados como los beneficios concretos:
CTA con bajo rendimiento:-❌ “Escanea el código QR para obtener más información”
-❌ “Visita nuestra página web” (código QR)
-❌ No hay llamada a la acción, solo una imagen con un código QR
CTA de alto rendimiento:-✅ “Escanea el código para conseguir un café gratis el día de tu cumpleaños” (registro en el programa de fidelización)
-✅ “Escanea el código para unirte al programa de recompensas y disfruta hoy mismo de un descuento de 10%” (incentivo inmediato)
-✅ “Escanea para hacer tu pedido por adelantado y evitar las colas” (ventaja práctica)
-✅ “Escanea para ver las ofertas del día” (pertinencia temporal)
Diferencia de rendimiento: Las llamadas a la acción (CTA) contundentes generan entre tres y cinco veces más tasas de visualización que las indicaciones genéricas2. Optimizar el tamaño y la ubicación del código QRRequisitos de tamaño:-Tamaño mínimo: 2,0 × 2,0 cm (es posible que los códigos más pequeños no se lean correctamente)
-Tamaño recomendado: de 2,5 a 3,8 cm (equilibrio entre la legibilidad y el uso del espacio)
-Corrección de errores: Nivel M o Q (permite una tolerancia al daño de 15-251 TP3T)
Estrategia de colocación por tipo de accesorio:Servilletas:-Ubicación: Posición de la esquina en la servilleta doblada (visible antes de usarla)
-Contexto: Incluir junto al texto de la llamada a la acción (“Escanea para unirte al programa de recompensas”)
-Consideración: La servilleta puede arrugarse o dañarse durante su uso; es importante que se vea bien desde el principio
Mangas de copa:-Ubicación: Panel trasero (frente al logotipo o marca principal)
-Contexto: El cliente gira la taza de forma natural para ver el diseño completo
-Beneficio: Un tiempo de permanencia prolongado (10-15 minutos) aumenta la probabilidad de detección
Pegatinas/Etiquetas:-Ubicación: En el centro o en un lugar destacado (la función principal puede ser un código QR)
-Contexto: Etiquetas de cierre para bolsas, precintos para envases
-Beneficio: Gran visibilidad al abrir los pedidos para llevar
Carteles de mesa (si se utiliza como accesorio):-Ubicación: Parte inferior orientada hacia el cliente
-Contexto: Incluye una llamada a la acción destacada con un código QR
-Beneficio: Atención personalizada (los clientes esperan a que se escaneen sus pedidos)
3. Enlaces a destinos optimizados para dispositivos móvilesLos códigos QR deben redirigir a páginas optimizadas para dispositivos móviles, con tiempos de carga rápidos y acciones claras:
Destinos interesantes:Inscripción en el programa de fidelización:-Formulario de registro en un solo paso (nombre, correo electrónico, teléfono)
-Confirmación inmediata y entrega de la primera recompensa
-Enlace de descarga de la aplicación móvil, si procede
-Tasa de conversión: 40-60% de escáneres: registro completo mediante un proceso simplificado
Menú digital/Pedidos:-Menú móvil con función de pedidos online
-Guarda los datos de contacto para agilizar los pedidos futuros
-La comodidad impulsa su adopción
Perfil en redes sociales:-Enlace de Instagram en Link.tree o en la biografía que redirige al perfil
-Incluir una llamada a la acción para seguirnos y un avance del contenido más reciente
-Tasa de conversión: 25-40% de escáneres asignados a la cuenta
Página de destino de la oferta especial:-Detalles de la promoción por tiempo limitado
-Mecanismo de canje (generación de códigos, cupón digital)
-La urgencia impulsa las búsquedas y las conversiones
Evite:-❌ Sitio web solo para ordenador (experiencia móvil deficiente)
-❌ Menús en PDF que hay que descargar
-❌ Páginas que tardan mucho en cargarse (los clientes las abandonan)
-❌ Procesos de varios pasos que requieren una gran cantidad de datos
4. Realizar un seguimiento y medir el rendimiento de los códigos QRUtiliza la analítica para comprender el comportamiento de los clientes y optimizar:
Métodos de seguimiento:URL únicas:-Crea direcciones URL distintas para cada tipo de accesorio o campaña
-Ejemplos: papacko.com/napkin-loyalty, papacko.com/sleeve-offer
-Utiliza acortadores de URL con funciones de análisis (Bitly, parámetros UTM de Google Analytics)
Indicadores de rendimiento que hay que supervisar:-Velocidad de exploración: Se han distribuido % de accesorios que generan escaneos (referencia: 8-15%)
-Tasa de conversión: % de escáneres que completan la acción deseada (referencia: 35-50%)
-Es hora de escanear: ¿Cuánto tiempo pasa desde que se reciben los escaneos de los clientes de accesorios (de inmediato o varias horas después)?
-Repetir exploraciones: El mismo cliente realiza varias lecturas (lo que indica una interacción continua)
Optimización basada en datos:-Baja tasa de escaneo (<5%) → Mejorar la CTA, aumentar el tamaño del código QR, reforzar la propuesta de valor
-Baja tasa de conversión (<25%) → Simplificar la página de destino, reducir los pasos y aclarar las ventajas
-Alta tasa de abandono → Comprueba la velocidad de carga de la página móvil y elimina los obstáculos
5. Proporciona contexto e instruccionesAunque la mayoría de los clientes saben cómo funcionan los códigos QR, unas breves instrucciones facilitan su uso:
Texto complementario:-“Apunta la cámara de tu móvil hacia el código para escanearlo” (para personas con menos conocimientos tecnológicos)
-Iconos que representan una cámara o un teléfono (señal visual)
-Método de acceso alternativo: “O visita [URL corta]” (para usuarios que no dispongan de un smartphone)
Aplicaciones de códigos QR con un alto retorno de la inversión:✅ Definir un objetivo claro (fidelización, redes sociales, pedidos, etc.) ✅ Crear una llamada a la acción (CTA) con una propuesta de valor atractiva ✅ Diseñar una página de destino optimizada para dispositivos móviles ✅ Generar un código QR con corrección de errores de nivel M/Q ✅ Probar el escaneo desde varios dispositivos antes de imprimir ✅ Implementar el seguimiento analítico (URL únicas o parámetros UTM) ✅ Dimensionar el código adecuadamente (mínimo 1×1 pulgadas) ✅ Colocarlo en un lugar destacado del accesorio con texto de apoyo ✅ Supervisar el rendimiento semanalmente y optimizarlo
Los códigos QR en los accesorios de los envases generan una interacción digital cuantificable con un coste adicional mínimo (la generación de los códigos QR es gratuita; solo es necesario reservar espacio para su diseño). Cuando se utilizan de forma estratégica, con propuestas de valor claras y experiencias móviles optimizadas, los códigos QR logran que entre el 3 % y el 91 % de los clientes realicen las acciones deseadas, lo que supera con creces las tasas de conversión de la publicidad tradicional.
Compartir contenido en las redes sociales amplía el alcance de la marca de forma exponencial —cada publicación de un cliente da a conocer tu marca a cientos o miles de seguidores—, lo que convierte el diseño de accesorios optimizados para Instagram en una estrategia de gran valor:
Principios de diseño visual para compartir contenido en redes sociales:1. Combinaciones de colores llamativas y fotogénicasEnfoques de color de alto rendimiento:-Colores vivos y lisos: Rosa milenario, verde menta, azul cobalto (destacan sobre fondos neutros)
-Combinaciones de alto contraste: Blanco y negro, azul marino y dorado, gris carbón y coral
-Combinaciones inesperadas: Combinaciones de colores que sorprenden y llaman la atención (verde azulado y terracota, morado y mostaza)
Evite:-Tonos tierra apagados que se funden con la mesa o el fondo (beige, marrón claro, verde oliva)
-Combinaciones de bajo contraste que no quedan bien en las fotos (gris y plateado, crema y blanco)
Estadísticas de Instagram: El análisis de las publicaciones sobre alimentación y bebidas con mejor rendimiento revela que 731 de ellas incluyen accesorios con colores vivos o de alto contraste, frente a solo 311 en las que aparecen accesorios de tonos neutros.2. Caligrafía y tipografía personalizada¿Por qué es eficaz?:-La estética auténtica y artesanal conecta con el público de Instagram
-Una tipografía única que se distingue del aspecto corporativo y estandarizado
-Las frases destacadas (“Pero primero, un café” o “Solo buenas vibraciones”) se integran en la composición de la foto
Implementación:-Encarga diseños caligrafiados a artistas locales
-Utiliza tipografías de trazo de pincel o tipografías orgánicas
-Incorpora mensajes de marca que se puedan compartir (“El café es mi forma de expresar el amor”)
3. Espacio negativo y diseño minimalistaPrincipio de equilibrio:-El exceso de elementos visuales recarga demasiado las fotos
-Un diseño limpio con amplios espacios en blanco crea una estética sofisticada y perfecta para Instagram
-Permite que la comida y la bebida sigan siendo el centro de atención, mientras que los accesorios las complementan
Enfoque recomendado:-Enfoque en un único elemento (logotipo O cita O motivo, no los tres)
-50-60% de superficie accesoria como espacio neutro
-Un toque estratégico de color o tipografía llama la atención sin resultar dominante
4. Estampados y texturasAtractivo visual:-Los estampados repetitivos (lunares, rayas, formas geométricas) aportan profundidad a las fotografías planas
-Las texturas que se aprecian en las fotos (logotipos en relieve, veteado del papel kraft) aportan un atractivo táctil
Ejemplos:-Fundas de papel kraft con tinta blanca (textura natural + contraste)
-Repetir pequeños logotipos como patrón de fondo
-Diseños geométricos con bloques de color
5. Integración de hashtags y mencionesLlamada a la acción directa en redes sociales en la sección de accesorios:En lugar de utilizar un “nosotros” genérico, incorpora hashtags y nombres de usuario concretos en el diseño:
Enfoques eficaces:-Hashtag de marca: “#MyBrandMoment” o “#BrandCoffeeClub”
-Nombre de usuario de Instagram: “@TuMarca” con el icono de Instagram
-Sugerencia fotográfica: “Comparte tu foto y etiqueta a @TuMarca”
Colocación:-Faldones de las copas: Panel lateral con un tamaño de letra legible (mínimo 10 pt)
-Servilletas: por la esquina o por el borde inferior
-Pegatinas: inclúyelas como parte del diseño general
Impacto: Las indicaciones directas multiplican por 2 a 4 el etiquetado de clientes en comparación con los accesorios que no incluyen llamadas a la acción en redes socialesEjemplos de casos prácticos:Ejemplo 1: Cafetería especializada “Daily Ritual”Enfoque de diseño:-Mangas acampanadas en rosa palo con la inscripción “Daily Ritual” escrita a mano en tinta blanca
-Texto secundario: “Comparte tu ritual @dailyritual #DailyRitualCoffee”
-Diseño minimalista con espacio negativo 60%
Resultados (campaña de seis meses):-847 publicaciones en Instagram con el hashtag ##DailyRitualCoffee
-1.340 nuevos seguidores en Instagram (un aumento de 521)
-En 781 publicaciones se mostraba de forma destacada una funda para vasos con la marca
-Alcance estimado: 284 000 impresiones (según el análisis de seguidores)
-Inversión en accesorios: $1.240
-Coste por impresión: $0,0044
-Coste por nuevo seguidor: 1,93
Ejemplo 2: “Greens & Grains”, un restaurante informal de comida saludable”Enfoque de diseño:-Servilletas de un verde intenso con el logotipo en blanco y el eslogan “Come plantas. Siéntete bien”.
-Tipografía en negrita, alto contraste
-Nombre de usuario de Instagram integrado en el pie de página del diseño
Resultados (Campaña de temporada de 8 semanas):-312 publicaciones de Instagram en las que aparecen servilletas con la marca
-Platos promocionados a través de colaboraciones con influencers (los influencers fotografiaron los platos con servilletas)
-680 nuevos seguidores
-Contenido generado por los usuarios reutilizado para el perfil de Instagram del restaurante
-El efecto de los influencers: Las servilletas con el logotipo de la marca que aparecieron en las publicaciones de los influencers dieron a conocer la marca a un total de 87 000 seguidores
Enfoque de pruebas de diseño:Antes de decidirse por tiradas de gran volumen:
1.Crear maquetas mostrar los accesorios en su contexto (taza de café con funda, plato con servilleta)
2.Publica bocetos en las historias de Instagram Encuesta a los seguidores: “¿Qué diseño fotografiarías?”
3.Analizar las respuestas en cuanto a preferencias de diseño
4.Solicitar una tirada pequeña de impresión digital (entre 2 000 y 5 000 unidades) para realizar pruebas en un entorno real
5.Supervisar las publicaciones en redes sociales durante 2 a 4 semanas
6.Calcular la tasa de participación: (Publicaciones de clientes en las que aparecen accesorios ÷ Total de clientes atendidos) × 100
7.Optimizar y ampliar: Invertir en una tirada flexográfica a gran escala del diseño ganador
Tipos de interés de referencia:-Accesorios genéricos o sin marca: Entre 0,5 y 11 clientes publican fotos
-Diseño de marca, pero estándar: Entre 1,5 y 31 clientes publican
-Diseño optimizado para Instagram: 4-8% de publicaciones de clientes
-Un diseño excepcional, digno de hacerse viral: 10-15%+ de publicaciones de clientes
Rentabilidad de la inversión del diseño optimizado para redes sociales:Aunque los diseños dignos de Instagram pueden costar entre un 10 % y un 20 % más que el diseño básico de marca (colores personalizados, costes de rotulación a mano, formas exclusivas), el retorno de la inversión en difusión en redes sociales justifica el precio superior:
Ejemplo de cálculo del ROI:Diseño estándar de la marca:
-Índice de cuota de clientes 2%
-10 000 clientes al año = 200 publicaciones en redes sociales
-Alcance medio de las publicaciones: 300 seguidores
-Total de impresiones: 60 000
-Coste del diseño: $600
Diseño optimizado para Instagram:
-Índice de cuota de clientes 6%
-10 000 clientes al año = 600 publicaciones en redes sociales
-Alcance medio de las publicaciones: 300 seguidores
-Total de impresiones: 180 000
-Coste de diseño: $720 (+20%)
Valor incremental:-Más de 120 000 impresiones con una inversión de más de 1 TP4T120
-Coste por impresión incremental: $0,001
-Un aumento del coste de 20% con un volumen de impresiones tres veces mayor = un retorno de la inversión excepcional
Conclusión: Invertir en el diseño de accesorios optimizados para las redes sociales genera unos beneficios extraordinarios gracias a la difusión que hacen los clientes al compartir el contenido, lo que la convierte en una de las estrategias de marketing con mayor retorno de la inversión a disposición de las empresas del sector de la restauración.Aunque las impresiones de marca proporcionan datos valiosos, vincular los accesorios de embalaje con el impacto en los ingresos es lo que demuestra el verdadero retorno de la inversión:
Métodos de atribución de ingresos:Método 1: Seguimiento del canje de promocionesIncluye ofertas con seguimiento en los accesorios:
Implementación:-Imprime códigos promocionales en servilletas o fundas: “Usa el código NAPKIN15 para obtener un descuento de 15% en tu próxima visita”.”
-Realizar un seguimiento de los canjes en el sistema de punto de venta
-Calcular: (Reembolsos × Importe medio por entrada) – (Coste del descuento + Inversión en accesorios)
Ejemplos de resultados (Cafetería con fundas personalizadas): Inversión: $840 (20 000 fundas con código promocional) Periodo de distribución: 3 meses Código promocional: “SLEEVE10” (10% de descuento en la próxima visita)Canjeos: 340 clientes (tasa de canje del 1,71 %) Importe medio por cliente: 9,50 Ingresos brutos por canjeos: 3.230 Coste de los descuentos: 323 (101 TP3T de ingresos) Ingresos netos atribuidos: 1 TP4T 2.907 ROI: (1 TP4T 2.907 – 1 TP4T 840) ÷ 1 TP4T 840 = 2.461 TP3T
Más: Muchos usuarios que canjean sus puntos se convierten en clientes habituales, lo que genera un valor de por vida adicional más allá del canje inicialMétodo 2: Atribución del programa de fidelizaciónRealiza un seguimiento de las inscripciones en programas de fidelización generadas por los códigos QR de los envases:
Implementación:-Los códigos QR de los accesorios redirigen a la página de registro en el programa de fidelización
-Realizar un seguimiento de la fuente de captación en el CRM o la plataforma de fidelización
-Calcular el valor de por vida de los miembros captados a través de los envases
Ejemplos de resultados (Restaurante de comida rápida informal): Inversión: 1 416,80 TPL (servilletas personalizadas con código QR) Periodo de distribución: 4 meses Total de clientes atendidos: 18 400Escaneos de códigos QR: 1.472 (tasa de escaneo de 8%) Inscripciones en el programa de fidelización: 736 (conversión de 50%) LTV medio de los miembros del programa de fidelización: $280 (a lo largo de 18 meses) LTV atribuido: 736 × $280 = $206 080
ROI: ($206 080 – $1 680) ÷ $1 680 = 12 167% (durante un periodo de LTV de 18 meses) Ingresos reconocidos en el primer año: ~$68 000 ROI del primer año: ~3 950%
Nota: El valor de vida del cliente (LTV) de los miembros del programa de fidelización se calcula a partir de datos históricos (gasto medio, frecuencia de visitas y periodo de retención).Método 3: Comparación mediante pruebas A/BCompara el comportamiento de los clientes con respecto a los accesorios de marca frente a los genéricos:
Implementación:-Periodos de la prueba A/B: 4 semanas con accesorios de marca, 4 semanas con accesorios genéricos (o al revés)
-Manteniendo constantes todas las demás variables
-Comparar métricas: tasa de visitas recurrentes, ticket medio, crecimiento en redes sociales, captación de nuevos clientes
Ejemplos de resultados (Prueba A/B de Café):1.º periodo (Servilletas y fundas blancas genéricas):
-Total de clientes: 4.200
-Nuevos clientes: 840 (20%)
-Índice de visitas repetidas (en un plazo de 30 días): 31%
-Seguidores de Instagram ganados: 87
Segunda fase (accesorios de marca con llamada a la acción en redes sociales):
-Total de clientes: 4.350 (+3,61 % en el tercer trimestre)
-Nuevos clientes: 957 (+141 TP3T)
-Índice de visitas repetidas (en un plazo de 30 días): 37% (+19%)
-Seguidores de Instagram ganados: 234 (+169%)
Impacto atribuido:-Visitas repetidas incrementales: 262 visitas (mejora de 61 TP3T × 4.350 clientes)
-Precio medio de la entrada: 1 TP 4 T 8,75
-Ingresos incrementales: $2.293
-Inversión en accesorios para el periodo: $520
-Período de ROI: 341%
Método 4: Segmentación por el valor del ciclo de vida del clienteSegmentar a los clientes según su interés por los accesorios de marca:
Implementación:-Realiza un seguimiento de los clientes que han escaneado códigos QR, canjeado promociones de accesorios o publicado contenido en redes sociales en el que aparecen accesorios
-Compara el gasto y la frecuencia de visita en los últimos 12 meses de los clientes “comprometidos” frente a los “no comprometidos”
-Atribuir parte de la diferencia al acoplamiento de los accesorios
Ejemplos de resultados (Segmentación de clientes de restaurantes):Clientes que han interactuado (han escaneado un código QR, han canjeado una oferta o han publicado en redes sociales):
-Número: 1.240 clientes
-Promedio de visitas al año: 8,7
-Gasto medio anual: $287
Clientes no activos (que han recibido accesorios de la marca, pero no se ha registrado ninguna interacción):
-Número: 18 760 clientes
-Promedio de visitas al año: 3,2
-Gasto medio anual: $104
Análisis:-Prima por cliente activo: $183 por cliente al año
-La correlación entre el uso de accesorios y el compromiso sugiere que los accesorios fomentan una relación más profunda
-Atribución conservadora: 30% de la prima atribuible a la interacción con los accesorios = $55 por cliente que interactúa
-Valor total atribuido: 1 240 × $55 = $68 200 al año
Método 5: Atribución de fuentes de nuevos clientesRealice una encuesta a los nuevos clientes sobre cómo se enteraron de nosotros:
Implementación:-Pregunta en el punto de venta o formulario de inscripción al programa de fidelización: “¿Cómo nos ha conocido?”
-Haz un seguimiento de las respuestas que mencionen: las redes sociales (a menudo impulsadas por los complementos), el boca a boca (los complementos favorecen que se comparta el contenido) y “he visto tu embalaje”.”
-Calcular el valor de adquisición
Ejemplos de resultados:Nuevos clientes trimestrales: 1.840 Índice de respuesta a la encuesta: 68,1 % (1.251 respuestas)
Fuentes de atribución:
-Redes sociales: 438 (35%) — Muchas de ellas impulsadas por publicaciones de clientes en las que aparecen accesorios de la marca
-Boca a boca: 363 (29%) — Potenciado por un envase de marca memorable
-Materiales de embalaje o de marca vistos: 125 (10%) — Atribución directa
-Otros: 325 (261 TP3T)
Atribución conservadora de accesorios:-Directo (“embalaje en rollo”): 125 clientes
-Red social parcial (suponiendo que el 40% del tráfico procedente de redes sociales se debe a publicaciones que muestran accesorios): 175 clientes
-Boca a boca parcial (suponiendo que el modelo 20% se vea potenciado por un embalaje llamativo): 73 clientes
-Total atribuido: 373 clientes por trimestre = 1.492 clientes al año
Valor del ciclo de vida del cliente: $420 LTV atribuido: 1.492 × $420 = $626.640 (a lo largo de varios años) Inversión anual en accesorios: $6.400 Rentabilidad de la inversión a largo plazo: 9,691%Valor estimado para el primer año (suponiendo un LTV de 301 %): ~1,88 millones de eurosRentabilidad en el primer año: 2,838%
Panel de control de métricas integrado:Combina varias métricas para obtener una visión global:
-Semanal: Escaneo de códigos QR, canje de ofertas promocionales, publicaciones en redes sociales
-Mensualmente: Inscripciones en programas de fidelización, fuentes de captación de clientes
-Trimestral: Análisis de pruebas A/B, comparación de cohortes de LTV, cálculo exhaustivo del ROI
-Anualmente: Evaluación del impacto a largo plazo, optimización de la estrategia
Mediante la aplicación de múltiples métodos de medición y un seguimiento constante, las empresas pueden demostrar el impacto concreto que tienen en los ingresos las inversiones en accesorios de embalaje, lo que justifica la continuidad y la ampliación de los programas basándose en datos y no en suposiciones.
–Conclusión
Los accesorios para el envasado de alimentos representan oportunidades de promoción de marca de gran valor y poco aprovechadas, que generan entre 4 y 7 impresiones por cliente en cada transacción, a un coste entre un 60 % y un 80 % inferior al de los canales publicitarios tradicionales. La personalización estratégica de servilletas, fundas para vasos, pegatinas y cubiertos transforma los artículos desechables funcionales en activos de marketing que actúan de forma continua durante los momentos de consumo, cuando los clientes son más receptivos a los mensajes de marca.
Principales conclusiones:1.Las servilletas y los fundas para vasos personalizadas ofrecen un retorno de la inversión excepcional: Cada 1 000 euros invertidos generan entre 280 y 420 impresiones de marca, lo que supone un coste por impresión entre 6 y 9 veces inferior al de la publicidad digital, al tiempo que mejora la percepción de calidad y potencia la visibilidad en las redes sociales.
2.Los códigos QR tienden un puente entre la interacción física y la digital: La colocación estratégica de códigos QR en los accesorios genera acciones cuantificables (inscripción en programas de fidelización, seguidores en redes sociales, canje de ofertas promocionales) con tasas de conversión habituales de entre el 3 % y el 91 % del total de clientes, lo que supera con creces la conversión de la publicidad tradicional.
3.El diseño optimizado para Instagram aumenta el alcance orgánico: Los colores llamativos, las letras manuscritas, los diseños minimalistas y las llamadas a la acción integradas en las redes sociales multiplican por dos o por cuatro el número de veces que los clientes comparten contenido en redes sociales, en comparación con una imagen de marca genérica, lo que amplía el alcance de la marca a miles de seguidores sin ningún coste adicional.
4.Las pequeñas empresas pueden poner en marcha programas accesibles: Desde accesorios individuales (pegatinas con una inversión inicial de entre 1 y 4 000-6 000 TP), pasando por estrategias por fases, hasta la impresión digital con tiradas mínimas reducidas, todo ello permite crear una imagen de marca profesional sin costes prohibitivos para empresas de cualquier tamaño.
5.La atribución de ingresos pone de manifiesto el impacto en el negocio: Más allá de la primera impresión, los accesorios de embalaje generan resultados cuantificables, entre los que se incluyen un aumento del 15-25 % en las tasas de visitas repetidas, un retorno de la inversión (ROI) del 200-600 % durante el primer año y un aumento del 20-40 % en el valor del ciclo de vida de los clientes fieles.
Los accesorios para el envasado de alimentos ofrecen ventajas de marketing únicas: una mayor duración de la exposición (entre 10 y 20 minutos, frente a los 2-3 segundos de los anuncios habituales), asociaciones positivas con el contexto de consumo, potencial de difusión en redes sociales y recordatorios físicos que fomentan las visitas repetidas. La combinación de estos factores da lugar a herramientas de desarrollo de marca excepcionalmente rentables, al alcance de todo tipo de negocios, desde cafeterías con un solo local hasta cadenas con múltiples establecimientos.
A medida que el sector de la restauración se vuelve cada vez más competitivo y se convierte en un mercado de productos estandarizados, la diferenciación a través de experiencias de marca memorables —logradas mediante la personalización estratégica de los accesorios— ofrece una ventaja competitiva sostenible. Las empresas que consideran los accesorios de embalaje como activos de marketing, en lugar de como gastos operativos, obtienen beneficios extraordinarios gracias a un mayor reconocimiento de marca, la fidelidad de los clientes y un crecimiento rentable.
-“>Accesorios de embalaje: descubre la gama completa de accesorios personalizables de Papacko
-“>Vasos de papel: vasos y fundas personalizados para la imagen de marca de bebidas
-“>Envases para alimentos: soluciones integrales de envases para sistemas de marca completos
-“>Acerca de Papacko: descubre nuestras posibilidades de impresión personalizada y nuestro enfoque de colaboración con marcas
Papacko combina su experiencia en envases alimentarios con amplias capacidades de impresión personalizada, ayudando a restaurantes, cafeterías, food trucks y empresas de catering a convertir sus accesorios en potentes herramientas de marketing. Desde el asesoramiento en el diseño hasta la producción y la entrega, nuestro equipo ofrece orientación estratégica y excelencia en la fabricación para maximizar el impacto de su marca.
Con pedidos mínimos que oscilan entre las 5 000 y las 10 000 unidades para las pegatinas y entre las 10 000 y las 25 000 para las fundas, la personalización de accesorios con la marca es una opción al alcance de empresas de todos los tamaños que buscan soluciones de marketing rentables con un retorno de la inversión cuantificable.
Póngase en contacto:Última actualización: Mayo 2026