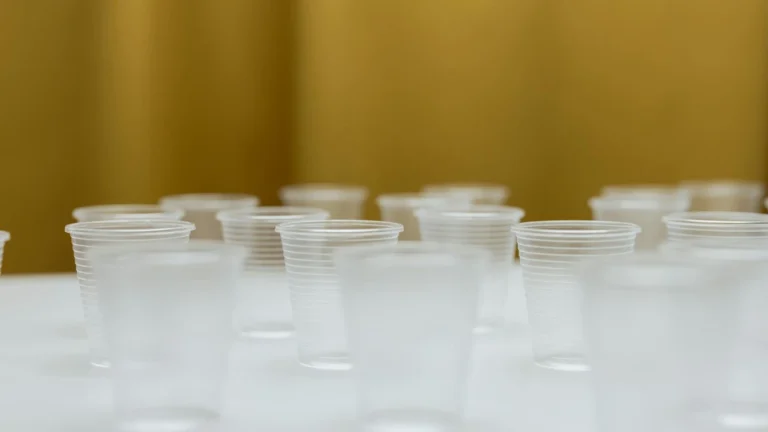
Готовы создать собственные фирменные бумажные стаканчики или упаковку?
Сообщите нам свои требования - размер, покрытие, печать и место назначения - и наша команда подготовит подробное коммерческое предложение в течение 24 часов.
Последнее обновление: Ноябрь 2025 г.
Время чтения: 8-10 минут
Автор: Papacko Content Team
Глобальный бумажные стаканчики В 2024 году объем оптового рынка составит $18,2 миллиарда, при этом 420 миллиардов единиц продукции будет произведено и распределено по каналам общественного питания, розничной торговли и институциональным каналам. За утренней суетой в каждом кафе и заботой о пациентах в каждой больнице стоит сложная цепочка поставок, в которой сбалансированы закупки сырья, производственные мощности, контейнерные перевозки и доставка точно в срок. Понимание этой динамики позволяет отделить выгодные закупки от дорогостоящих сбоев.
В этом руководстве рассматривается экосистема оптовой торговли бумажными стаканчиками от производителя до конечного покупателя, анализируются структуры цен, риски в цепочке поставок и стратегические методы поиска поставщиков для дистрибьюторов, крупных операторов общественного питания и предприятий, занимающихся экспортом/импортом.
В этой статье вы узнаете:
-Структура глобального рынка и основные производственные центры (Китай, Индия, Турция)
-Динамика ценообразования от сырья до себестоимости
-Уязвимые места в цепочке поставок и стратегии снижения рисков
-Экспортно-импортная логистика включая MOQ, сроки выполнения заказа и документацию
💡 Быстрый вынос: Оптовые цены на бумажные стаканчики 300-500% варьируются по всему миру в зависимости от доступности сырья, стоимости рабочей силы и логистики.
Чашка с полиэтиленовым покрытием объемом 12 унций стоит $0.025-0.035 FOB Китай по сравнению с чашкой с полиэтиленовым покрытием объемом 12 унций.
$0.08-0.12 высадился в Северной Америке.
Стратегические покупатели получают продукцию напрямую от производителей со сроком исполнения 60-90 дней, а за срочные заказы через дистрибьюторов выплачивается премия 40-80%.
Оптовый рынок бумажных стаканчиков включает в себя B2B сделки между производителями, дистрибьюторами, импортерами и крупными конечными пользователями, приобретающими стаканчики в количестве, превышающем 10 000 штук на один заказ. Ключевые сегменты рынка включают:
Категории покупателей:
Категории товаров:
-Однослойные стаканы (4-24 унции): 68% объема
-Стаканы с двойными стенками: 18% объема
-Специализация (печать на заказ, материалы премиум-класса): 14% объема
🎯 Отраслевой обзор: 72% оптовых объемов бумажных стаканчиков проходит через дистрибьюторов, которые агрегируют заказы от мелких и средних покупателей.
Только 28% - это прямые поставки от производителя к потребителю, как правило, это крупные сети с централизованными закупками (Starbucks, McDonald's, Sodexo).
Китай (45% глобальной мощности):
-Объем производства: ~190 миллиардов чашек в год
-Преимущество в стоимости: $0.020-0.030 FOB для стандартных чашек 12 унций с полиэтиленовым покрытием
-Ключевые регионы: Чжэцзян (Вэньчжоу, Тайчжоу), Гуандун (Дунгуань, Шэньчжэнь), Цзянсу
-Сильные стороны: Масштабные масштабы, интегрированная цепочка поставок (бумажные фабрики, покрытие, печать)
-Слабые стороны: Разница в качестве, проблемы с защитой интеллектуальной собственности, доставка в США/ЕС в течение 20-35 дней.
Индия (12% глобальной мощности):
-Объем производства: ~50 миллиардов чашек в год
-Стоимость: $0.025-0.035 FOB (немного выше стоимость труда + энергия)
-Экспортный фокус: Ближний Восток, Африка, Юго-Восточная Азия (географическое преимущество)
-Сильные стороны: Английский язык, растущий потенциал инвестиций
-Слабые стороны: Узкие места в инфраструктуре, нестабильное энергоснабжение
Турция (8% глобальной мощности):
-Объем производства: ~34 миллиарда чашек в год
-Стоимость: $0.035-0.045 FOB
-Географическое преимущество: 7-12 дней доставки в ЕС, доступ на Ближний Восток/Северную Африку
-Сильные стороны: Постоянство качества, согласование нормативных требований ЕС
-Слабые стороны: Ограниченный масштаб по сравнению с азиатскими конкурентами
Северная Америка Внутренние (15% глобальной мощности):
-Объем производства: ~63 миллиарда чашек (в основном для внутреннего потребления)
-Стоимость: $0.06-0.09 ex-factory (2-3× Китай FOB)
-Игроки: Dart Container, Huhtamaki, Georgia-Pacific, Solo Cup
-Сильные стороны: Отсутствие задержек при импорте, гарантированное качество/сертификация
-Слабые стороны: Высокие затраты на рабочую силу/энергию, ограниченная ценовая конкуренция
ЕС Внутренние (10% глобальной мощности):
-Объем производства: ~42 миллиарда чашек
-Стоимость: $0.07-0.11 ex-factory
-Регулирование: Строгие требования к контакту с пищевыми продуктами и охране окружающей среды
-Тренд: Консолидация (крупные игроки приобретают более мелкие фабрики)
Использование мощностей (2024):
Компоненты затрат (стандартный стакан 12 унций с полиэтиленовым покрытием):
Тенденции изменения цен на сырье (2020-2025):
Последствия: Оптовые цены на бумажные стаканчики тесно связаны с рынками целлюлозы и полиэтилена с задержкой в 2-3 месяца. Покупатели выигрывают от фиксации цен во время спадов на рынке целлюлозы (обычно III-IV кварталы).
Пример экспорта из Китая (стакан 12 унций, с покрытием PE, MOQ 500,000 шт.):
Структура разметки дистрибьютора:
-Стоимость дистрибьютора: $0.03425 приземлился
-Складские/погрузочные работы: +$0.008 за единицу
-Маржа дистрибьютора: 25-35% → +$0.011-0.015
-Оптовая цена для покупателя: $0.053-0.057 за единицу
-Разметка для конечного потребителя (при перепродаже): +30-50% → $0,069-0,086 за единицу
Основной вывод: Импортеры, закупающие 500 000+ единиц продукции напрямую у производителей, экономят 35-50% по сравнению с закупками у внутренних дистрибьюторов, но при этом должны контролировать сроки поставки 60-90 дней и гарантировать качество.
Вместимость контейнера 20 футов:
Кубовый контейнер высотой 40 футов:
-Вместимость: 2,2-2,5× 20′ контейнер
-Стоимость: 1,6-1,8× стоимость перевозки 20′
-Экономика подразделения: 20-30% лучшая стоимость перевозки на чашку
Драйверы стоимости морских грузоперевозок (2024-2025):
Волатильность рынка грузовых перевозок:
-2020-2021 (COVID): Рост стоимости грузоперевозок 300-500%
-2023-2024: Нормализация до +60-801ТП3Т выше базового уровня до начала действия программыCOVID
-Стратегия хеджирования: Крупные покупатели заключают с перевозчиками годовые контракты на поставку продукции.
Акционные/обычные стаканчики (белый/крафт, без печати):
-MOQ: 10 000-50 000 шт.
-Время выполнения заказа: 7-15 дней (из наличия на складе)
-Цена: Самые высокие показатели в расчете на единицу продукции (но самые низкие общие инвестиции)
-Пример использования: Срочные заказы, мелкие операторы, пробные закупки
Сток + наклейка с логотипом:
-MOQ: 20,000-100,000 шт.
-Время выполнения заказа: 15-25 дней (производство чашек на складе + нанесение наклеек)
-Цена: +10-15% по сравнению с полной пользовательской печатью
-Пример использования: Брендинг в рамках бюджета, последовательность франшизы без полной настройки
Индивидуальная 1-цветная печать:
-MOQ: 50 000–100 000 единиц
-Время выполнения заказа: 25-35 дней (изготовление пластин + производство)
-Стоимость установки: $300-800 (изготовление пластин/штампов)
-Пример использования: Кофейни, небольшие сети, простой брендинг
Полноцветная печать на заказ (CMYK):
-MOQ: 100 000-300 000 шт.
-Время выполнения заказа: 35-50 дней (утверждение дизайна, подбор цвета, производство)
-Стоимость установки: $800-2,000
-Цена: +20-35% по сравнению с запасом, но превосходное влияние бренда
-Пример использования: Крупные сети, премиальные бренды, ритейл с высокой проходимостью
Полностью на заказ (уникальный размер/форма/материал):
-MOQ: 300 000-1 000 000 единиц (амортизация штамповой оснастки)
-Время выполнения заказа: 60-90 дней
-Стоимость установки: $3,000-10,000 (пресс-формы на заказ, тестирование)
-Пример использования: Starbucks Reserve, ограниченные серии, инновационные проекты
Реалии планирования производства:
-Высокий сезон (Q3-Q4, праздники): Срок выполнения заказа 6-8 недель даже для заказов на складе
-Низкий сезон (Q1-Q2): Договориться о скидках 10-20% для производства в непиковый период
-Срочные заказы: 200-300% премия за ускоренное производство (если позволяют возможности)
Затраты на содержание запасов:
Рекомендация: Заказывайте 2-3 месяца для быстрореализуемых товаров, 1-2 месяца для нестандартных/сезонных дизайнов, чтобы сбалансировать стоимость и гибкость.
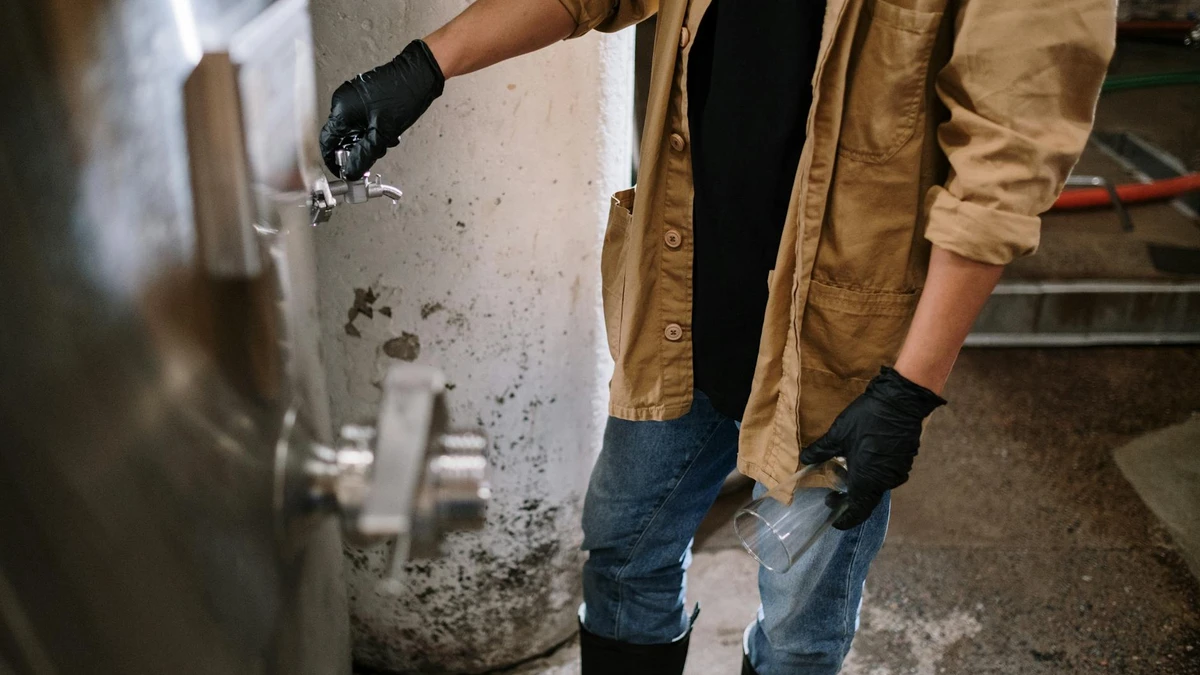
Критические контрольные точки качества:
Инспекционные услуги третьих лиц:
-SGS, Intertek, TÜV: $500-1,200 за инспекцию (образец 300-500 единиц)
-Когда использовать: Первый заказ от нового поставщика, производство >200 000 единиц
-ROI: Предотвращает $10 000-50 000 убытков от бракованных поставок
Необходимые сертификаты:
Красные флаги при проверке поставщиков:
❌ Отказ от аудита завода: Вероятно, проблемы с пропускной способностью или качеством
❌ Никаких сертификатов: Регуляторный риск, может не пройти таможенный контроль
❌ Цена 30%+ ниже рыночной: Где-то срезаны углы (материал, труд, безопасность)
❌ Нежелание предоставлять образцы: Проблемы с качеством
❌ Отсутствие опыта экспорта: Ошибки в документации, задержки с отправкой
Производитель/Экспортер Предоставляет:
Покупатель/Импортер Обеспечивает:
-Лицензия на импорт (если требуется в стране назначения)
-Налоговый идентификатор / регистрация импорта
-Аккредитив (если условием оплаты является аккредитив)
Соединенные Штаты:
-Код HS: 4823.69 (Прочие изделия из бумажной массы, бумаги и т.д.)
-Тарифная ставка: 0-5,5% (зависит от материала, покрытия)
-Торговые соглашения: USMCA (0% из Канады/Мексики), GSP (варьируется)
Европейский союз:
-Код HS: 4823.69
-Тарифная ставка: 0-6.5%
-Нетарифные барьеры: Соответствие требованиям REACH (химическая безопасность), регулирование контакта с пищевыми продуктами
Великобритания (после Brexit):
-Код HS: 4823.69
-Тарифная ставка: 0-6.5% (пока согласовано с ЕС)
-Уникальное требование: Маркировка UKCA для материалов, контактирующих с пищевыми продуктами
Ближний Восток (ОАЭ, Саудовская Аравия):
-Тарифная ставка: 5-10%
-Сертификация халяль: Не требуется для бумажных стаканчиков, но некоторые покупатели требуют.
-Стандарты SASO/ESMA: Сертификаты безопасности продукции
Стратегии экономии на долге:
-Зоны свободной торговли: Импорт в ЗСТ, оплата пошлины только при выпуске на рынок (отсрочка денежного потока)
-Охраняемые склады: Хранение импортных товаров без уплаты пошлины до их продажи
-Тарифное проектирование: Корректировка спецификаций продукции для получения права на более низкую классификацию кода ТН ВЭД
Восстановление пищевого производства (после пандемии):
-2024: Трафик фудсервиса на уровне 102% от уровня 2019 года (полное восстановление + рост)
-2025-2030 CAGR: 4,2% рост спроса на бумажные стаканчики в сфере общественного питания
-Драйвер: Расширение QSR, культура кофе на развивающихся рынках
Мандаты устойчивого развития:
-Запрет на использование одноразового пластика: 72 страны с активным запретом к 2025 году → Замена бумажных стаканчиков
-Корпоративное ESG: Крупнейшие сети (McDonald's, Starbucks) обязуются создать 100% экологичной упаковки к 2025-2030 гг.
-Предпочтения потребителей: 68% готовы платить на 5-10% больше за экологичные варианты
Электронная коммерция и доставка:
-Рост доставки еды: 12% CAGR (2024-2028) → рост использования стаканчиков на вынос
-Кухни-призраки: 2 500+ операционных в одних только США → оптовая закупка стаканчиков
Расширение мощностей:
-Индия: $2,1 млрд инвестиций в мощности по производству бумажной упаковки (2024-2027)
-Юго-Восточная Азия: Вьетнам, Индонезия наращивают производство (преимущество в стоимости рабочей силы)
-Ближний подбор: Мексика добавляет 3 крупных завода для обслуживания рынка США (сокращение времени/стоимости доставки)
Инновационный материал:
-Покрытия на водной основе: 18% в 2024 году → прогнозируется 45% к 2028 году (возможность переработки)
-Покрытия PLA: 12% в 2024 году → 22% к 2028 году (спрос на компостируемость)
-Барьерная технология: Появление минеральных покрытий (непластичных) (в настоящее время принятие 3%)
Перспективы ценообразования (2025-2030):
## Рекомендации по стратегическому сорсингу
Небольшие сети (50 000-200 000 чашек в месяц):
-Стратегия: Закупки у отечественных дистрибьюторов в течение первых 1-2 лет (минимизация сложностей)
-Переход: Как только объем превысит 200 000/месяц, протестируйте прямой импорт (1-2 контейнера)
-Количество поставщиков: Поддерживать 2 поставщиков (основной + резервный) для снижения риска
Средние сети (500 000-2 000 000 чашек в месяц):
-Стратегия: Прямой импорт от 1-2 азиатских производителей (Китай/Индия), резервное копирование внутри страны
-Контракт: Ежегодные обязательства по объемам для снижения цены на 5-10%
-Качество: Привлечение третьей стороны (SGS) для проверки каждого груза
Крупные предприятия (5 000 000+ чашек в месяц):
-Стратегия: Мультиисточники (Азия - первичные, внутренние - вторичные, ближние - развивающиеся)
-Производственные партнерства: Совместное инвестирование в специализированные производственные линии для заказных спецификаций
-Логистика: Заключайте контракты напрямую с судоходными линиями (избегайте наценок экспедиторов)
-Хеджирование: Финансовые инструменты для фиксации стоимости сырья (фьючерсы на целлюлозу)
Рычаги воздействия:
1.Обязательства по объему: Гарантируем 12-месячный прогноз на скидку 8-12%
2.Условия оплаты: Предоплата (депозит 50%) позволяет получить льготу по цене 3-5%
3.Гибкость: Согласитесь на более длительное время выполнения заказа (90 дней против 60) для экономии 5-8%
4.Производство в непиковые часы: Заказывайте в Q1-Q2 (низкий сезон) для получения скидок 10-15%
Красные линии (не идите на компромисс):
-Сертификаты качества: Всегда требуйте соответствия требованиям FDA/EU (не обсуждается)
-Право на осмотр: Оставьте за собой право на заводской аудит перед крупными заказами
-Форс-мажор: Ограничьте ответственность за нарушения в цепочке поставок, но обеспечьте резервные поставки
❌ Ошибка #1: Выбор поставщика только по самой низкой цене без аудита завода
✅ Правильный подход: Посещение завода или привлечение стороннего инспектора для заказов >$50,000. Проверьте возраст оборудования, источники сырья, контроль качества
❌ Ошибка #2: Заказ именно того, что вам нужно, с нулевым буфером
✅ Правильный подход: Добавьте запас 3-5% к заказу. Задержки с отгрузкой, брак по качеству и скачки спроса будут иметь место - буфер предотвращает нехватку запасов
❌ Ошибка #3: Оплата по безналичному расчету до начала производства/инспекции
✅ Правильный подход: Используйте аккредитив или услуги эскроу для первых 2-3 заказов. Выпуск 70% при осмотре, 30% при поставке
❌ Ошибка #4: Игнорирование оптимизации классификации тарифов
✅ Правильный подход: Уточните код ТН ВЭД у таможенного брокера. Небольшие изменения в спецификации могут перейти от тарифа 5.5% к тарифу 0%
Оптовый рынок бумажных стаканчиков включает в себя сделки B2B, в рамках которых покупатели приобретают у производителей или дистрибьюторов 10 000+ единиц продукции на один заказ. В 2024 году его объем составит $18,2 млрд (420 млрд единиц) по всему миру, в том числе на предприятиях общественного питания, в учреждениях и розничной торговле.
MOQ варьируется в зависимости от вида заказа: 10 000-50 000 штук для складских стаканчиков, 50 000-100 000 штук для 1-цветной печати, 100 000-300 000 штук для полной печати CMYK и 300 000-1 000 000 штук для нестандартных размеров/форм. Экономия на контейнерных перевозках позволяет импортировать более 500 000 единиц продукции.
Стандартные стаканчики 12 унций с полиэтиленовым покрытием: $0.020-0.030 FOB Китай, $0.035-0.045 FOB Турция, $0.06-0.09 ex-factory Северная Америка, $0.053-0.057 у американских дистрибьюторов (наземная цена + наценка). Компостируемое PLA-покрытие добавляет премию 20-35%.
Сток/обычная печать: 7-15 дней, печать на заказ: 25-50 дней, морская перевозка добавляет 14-38 дней (Китай→США), полный цикл от PO до доставки: 45-90 дней для импорта, 15-30 дней для внутреннего рынка. Пиковый сезон (Q3-Q4) добавляет 2-4 недели.
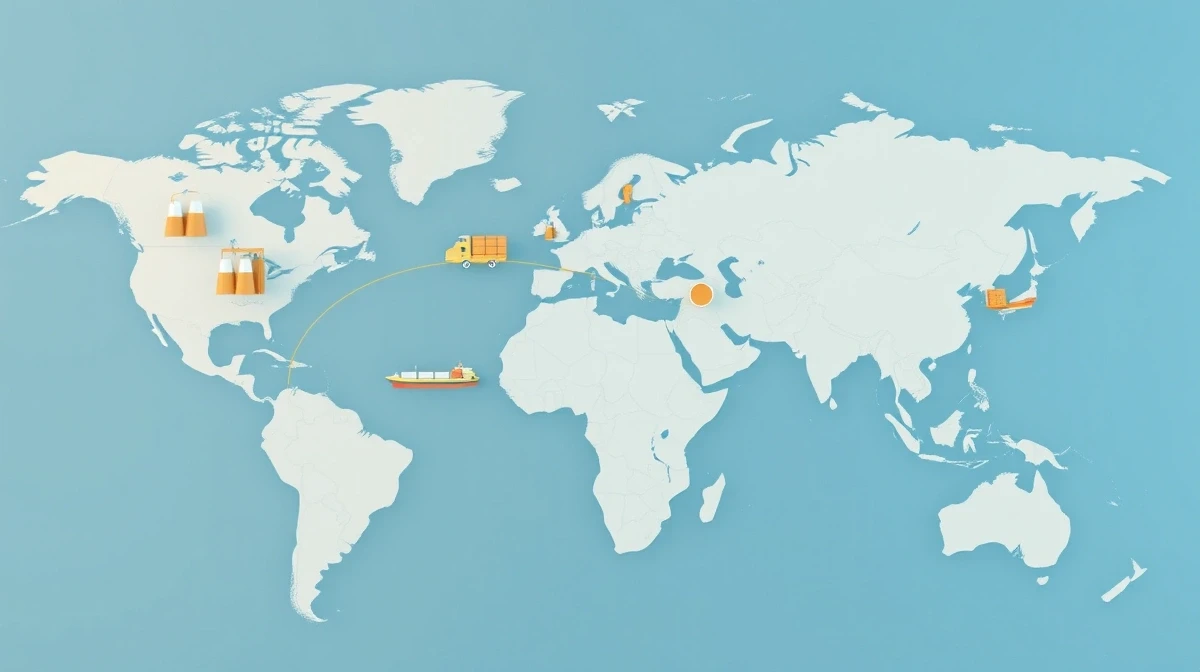
Китай производит 45% мирового объема (~190 млрд чашек/год), Индия - 12%, Турция - 8%, Северная Америка - 15%, ЕС - 10%. Китай предлагает самую низкую стоимость FOB ($0.020-0.030), но самую долгую доставку. Турция обеспечивает преимущество близости к ЕС.
FDA Контакт с пищевыми продуктами Уведомление (рынок США), Постановление ЕС 10/2011 соответствие (Европа), FSC/PEFC (устойчивое лесное хозяйство), ISO 9001 (управление качеством). Сторонние испытания (SGS, Intertek) рекомендуются при первых заказах и поставках свыше 200 000 единиц продукции.
Прямые поставки от производителя (экономия 35-50% по сравнению с дистрибьюторами), заказы контейнерными партиями (500 000+ единиц), ежегодные обязательства по объемам (скидка 8-12%), производство в непиковый период (Q1-Q2, скидка 10-15%), конкуренция с несколькими поставщиками, оптимизация сроков оплаты (предоплата позволяет получить 3-5%).
Оптовый рынок бумажных стаканчиков функционирует как сложная глобальная экосистема, в которой волатильность сырья, производственные мощности, логистика доставки и соблюдение нормативных требований пересекаются, определяя цены и доступность. Успешные покупатели ориентируются в этом ландшафте не за счет разовых транзакционных закупок, а благодаря стратегическим отношениям с поставщиками, диверсификации цепочки поставок и проактивному управлению качеством.
Основные выводы:
1.Географический арбитраж затрат является значительным: FOB Китай ($0.020-0.030) по сравнению с внутренним рынком Северной Америки ($0.06-0.09) обеспечивает экономию 35-50% для импортеров, готовых работать с 60-90-дневными сроками поставки.
2.Экономика контейнерных перевозок имеет значение: 500 000+ единичных заказов оптимизируют расходы на перевозку (экономия 40%+ на единицу продукции по сравнению с LCL/авиаперевозкой).
3.Обеспечение качества не подлежит обсуждению: Проверка третьей стороной ($500-1 200) предотвращает $10 000-50 000 убытков от бракованных грузов
4.Мультисорсинг снижает риски: Основной азиатский поставщик + резервный внутренний поставщик обеспечивает баланс между стоимостью и надежностью поставок
5.Устойчивое развитие определяет будущие цены: Покрытия на водной основе/PLA сейчас занимают 20-35% премий, но по мере ужесточения правил (2025-2030) станут базовыми.
Будь то дистрибьютор, консолидирующий поставки, сеть QSR, оптимизирующая закупки, или импортер, формирующий портфель бумажной продукции, понимание динамики цепочки поставок позволит вам договориться о более выгодных условиях, проактивно управлять рисками и использовать неэффективность рынка, которая отделяет прибыльные операции от эрозии маржи.
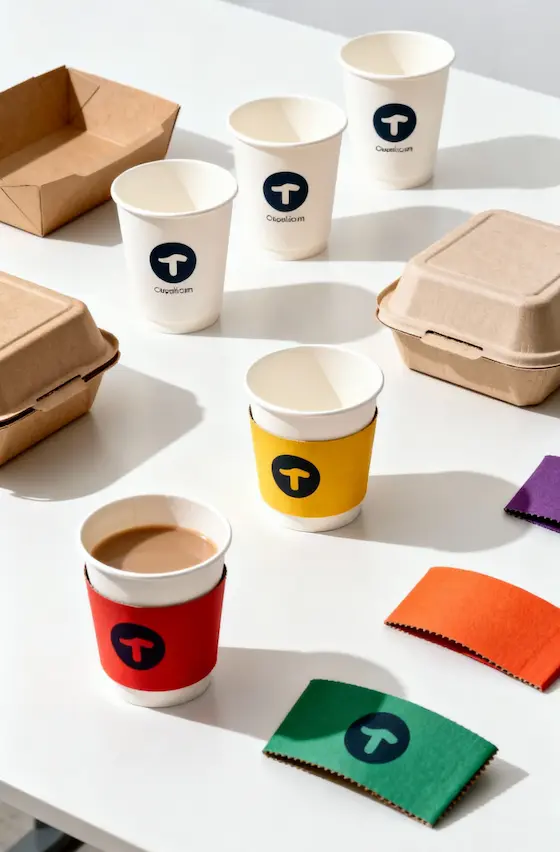
-Контейнеры для упаковки пищевых продуктов
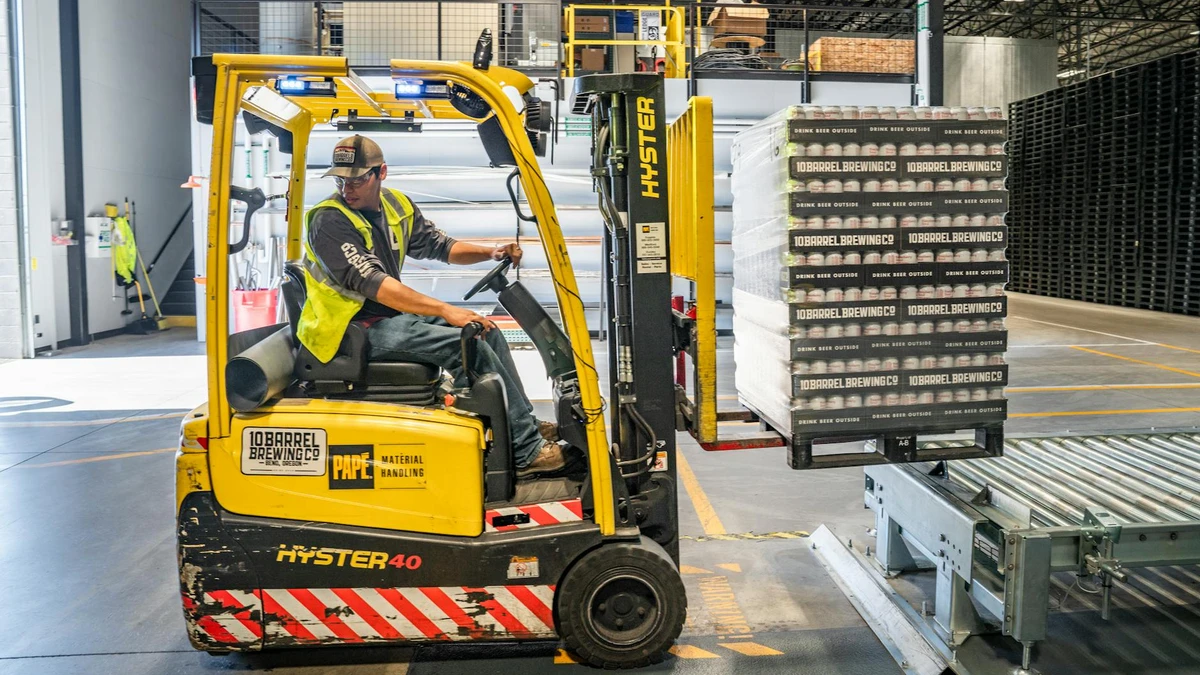
Компания Papacko производит и экспортирует бумажные стаканчики в 45+ стран мира с производственной мощностью 12 миллиардов штук в год. Мы предлагаем MOQ от 50 000 единиц, сертифицированные материалы FDA/EU и прямые поставки полными контейнерами. Наша цепочка поставок включает 60-дневное планирование производства, предотгрузочную инспекцию SGS и обработку экспортной документации.
Wholesale sourcing decisions usually depend on demand signals, chain-level buying requirements, export paperwork, and a clear view of the production system behind the quote.
Свяжитесь с нами:
Последнее обновление: Ноябрь 2025 г.