Готовы создать собственные фирменные бумажные стаканчики или упаковку?
Сообщите нам свои требования - размер, покрытие, печать и место назначения - и наша команда подготовит подробное коммерческое предложение в течение 24 часов.
Последнее обновление: Ноябрь 2025 г.
Время чтения: 8-10 минут
Автор: Papacko Content Team
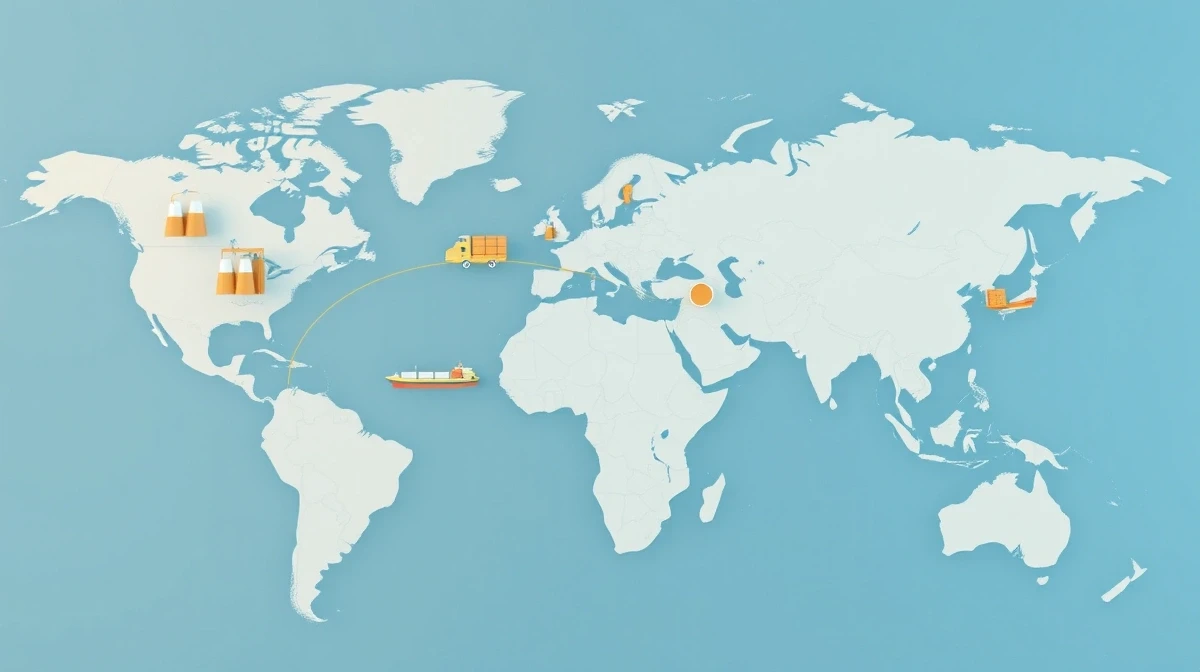
The global бумажные стаканчики wholesale market moved $18.2 billion in 2024, with 420 billion units manufactured and distributed across foodservice, retail, and institutional channels. Behind every café’s morning rush and every hospital’s patient care stands a complex supply chain balancing raw material procurement, manufacturing capacity, containerized shipping, and just-in-time delivery. Understanding these dynamics separates profitable procurement from costly disruptions.
This guide examines the paper cups wholesale ecosystem from manufacturer to end-buyer, analyzing pricing structures, supply chain risks, and strategic sourcing practices for distributors, large foodservice operators, and export/import businesses.
В этой статье вы узнаете:
-Global market structure and major manufacturing hubs (China, India, Turkey)
-Pricing dynamics from raw materials to landed costs
-Supply chain vulnerabilities and risk mitigation strategies
-Export/import logistics including MOQs, lead times, and documentation
💡 Быстрый вынос: Paper cup wholesale prices vary 300-500% globally based on raw material access, labor costs, and logistics.
A 12oz PE-coated cup costs $0.025-0.035 FOB China vs.
$0.08-0.12 landed in North America.
Strategic buyers source direct from manufacturers with 60-90 day lead times, while urgent orders through distributors pay 40-80% premiums.
The paper cups wholesale market comprises B2B transactions between manufacturers, distributors, importers, and large-scale end-users purchasing cups in quantities exceeding 10,000 units per order. Key market segments include:
Buyer Categories:
Product Categories:
-Однослойные стаканы (4-24 oz): 68% of volume
-Double-wall/ripple cups: 18% of volume
-Specialty (custom print, premium materials): 14% of volume
🎯 Отраслевой обзор: 72% of paper cup wholesale volume flows through distributors who aggregate orders from small-to-medium buyers.
Only 28% is direct manufacturer-to-end-user, typically large chains with centralized procurement (Starbucks, McDonald’s, Sodexo).
Китай (45% of global capacity):
-Production Volume: ~190 billion cups annually
-Преимущество в стоимости: $0.020-0.030 FOB for standard 12oz PE-coated cups
-Key Regions: Zhejiang (Wenzhou, Taizhou), Guangdong (Dongguan, Shenzhen), Jiangsu
-Strengths: Massive scale, integrated supply chain (paper mills, coating, printing)
-Weaknesses: Quality variation, IP protection concerns, 20-35 day shipping to US/EU
Индия (12% of global capacity):
-Production Volume: ~50 billion cups annually
-Стоимость: $0.025-0.035 FOB (slightly higher labor + energy costs)
-Export Focus: Middle East, Africa, Southeast Asia (geographic advantage)
-Strengths: English language, growing capacity investment
-Weaknesses: Infrastructure bottlenecks, inconsistent power supply
Турция (8% of global capacity):
-Production Volume: ~34 billion cups annually
-Стоимость: $0.035-0.045 FOB
-Geographic Advantage: 7-12 day shipping to EU, access to Middle East/North Africa
-Strengths: Quality consistency, EU regulatory alignment
-Weaknesses: Limited scale vs. Asian competitors
North America Domestic (15% of global capacity):
-Production Volume: ~63 billion cups (primarily for domestic consumption)
-Стоимость: $0.06-0.09 ex-factory (2-3× China FOB)
-Players: Dart Container, Huhtamaki, Georgia-Pacific, Solo Cup
-Strengths: Zero import delays, guaranteed quality/certifications
-Weaknesses: High labor/energy costs, limited price competition
EU Domestic (10% of global capacity):
-Production Volume: ~42 billion cups
-Стоимость: $0.07-0.11 ex-factory
-Регулирование: Stringent food contact and environmental compliance
-Тренд: Consolidation (major players acquiring smaller mills)
Capacity Utilization (2024):
Cost Components (Standard 12oz PE-Coated Cup):
Raw Material Price Trends (2020-2025):
Последствия: Paper cup wholesale prices closely track pulp and PE markets with 2-3 month lag. Buyers benefit from locking prices during pulp troughs (typically Q3-Q4).
China Export Example (12oz Cup, PE-Coated, MOQ 500,000 pcs):
Distributor Markup Structure:
-Distributor Cost: $0.03425 landed
-Warehouse/Handling: +$0.008 per unit
-Distributor Margin: 25-35% → +$0.011-0.015
-Wholesale Price to Buyer: $0.053-0.057 per unit
-End-Retail Markup (if resold): +30-50% → $0.069-0.086 per unit
Основной вывод: Importers buying 500,000+ units direct from manufacturers save 35-50% vs. purchasing from domestic distributors, but must manage 60-90 day lead times and quality assurance.
20-Foot Container Capacity:
40-Foot High-Cube Container:
-Вместимость: 2.2-2.5× a 20′ container
-Стоимость: 1.6-1.8× the freight cost of 20′
-Unit Economics: 20-30% better per-cup freight cost
Ocean Freight Cost Drivers (2024-2025):
Freight Market Volatility:
-2020-2021 (COVID): Freight costs spiked 300-500%
-2023-2024: Normalization to +60-80% above pre-COVID baseline
-Hedging Strategy: Large buyers negotiate annual contracts with carriers for volume commitments
Stock/Generic Cups (White/Kraft, No Print):
-MOQ: 10,000-50,000 units
-Время выполнения заказа: 7-15 days (ex-stock in warehouse)
-Цена: Highest per-unit (but lowest total investment)
-Пример использования: Urgent orders, small operators, trial purchases
Stock + Logo Sticker:
-MOQ: 20,000-100,000 units
-Время выполнения заказа: 15-25 days (stock cup production + sticker application)
-Цена: +10-15% vs. full custom print
-Пример использования: Branding on budget, franchise consistency without full custom
Custom 1-Color Print:
-MOQ: 50 000–100 000 единиц
-Время выполнения заказа: 25-35 days (plate making + production)
-Стоимость установки: $300-800 (plate/die making)
-Пример использования: Coffee shops, small chains, straightforward branding
Custom Full-Color Print (CMYK):
-MOQ: 100,000-300,000 units
-Время выполнения заказа: 35-50 days (design approval, color matching, production)
-Стоимость установки: $800-2,000
-Цена: +20-35% vs. stock, but superior brand impact
-Пример использования: Major chains, premium brands, high-visibility retail
Fully Custom (Unique Size/Shape/Material):
-MOQ: 300,000-1,000,000 units (die tooling amortization)
-Время выполнения заказа: 60-90 days
-Стоимость установки: $3,000-10,000 (custom molds, testing)
-Пример использования: Starbucks Reserve, limited editions, innovation projects
Manufacturer Scheduling Realities:
-Высокий сезон (Q3-Q4, holidays): 6-8 week lead times even for stock orders
-Низкий сезон (Q1-Q2): Negotiate 10-20% discounts for off-peak production
-Срочные заказы: 200-300% premium for expedited production (if capacity allows)
Inventory Holding Costs:
Рекомендация: Order 2-3 months supply for fast-moving stock items, 1-2 months for custom/seasonal designs to balance costs and flexibility.
Critical Quality Checkpoints:
Third-Party Inspection Services:
-SGS, Intertek, TÜV: $500-1,200 per inspection (300-500 unit sample)
-Когда использовать: First order from new supplier, production >200,000 units
-ROI: Prevents $10,000-50,000 losses from defective shipments
Essential Certifications:
Red Flags in Supplier Vetting:
❌ Refuses factory audit: Likely hiding capacity or quality issues
❌ No certifications: Regulatory risk, may fail customs
❌ Price 30%+ below market: Corners cut somewhere (material, labor, safety)
❌ Unwilling to provide samples: Quality concerns
❌ No export experience: Documentation errors, shipment delays
Manufacturer/Exporter Provides:
Buyer/Importer Provides:
-Import License (if required in destination country)
-Tax ID / Import Registration
-Аккредитив (if payment term is L/C)
United States:
-Код HS: 4823.69 (Other articles of paper pulp, paper, etc.)
-Tariff Rate: 0-5.5% (depends on material, coating)
-Trade Agreements: USMCA (0% from Canada/Mexico), GSP (varies)
European Union:
-Код HS: 4823.69
-Tariff Rate: 0-6.5%
-Non-Tariff Barriers: REACH compliance (chemical safety), food contact regulation
United Kingdom (Post-Brexit):
-Код HS: 4823.69
-Tariff Rate: 0-6.5% (aligned with EU for now)
-Unique Requirement: UKCA marking for food contact materials
Middle East (UAE, Saudi Arabia):
-Tariff Rate: 5-10%
-Halal Certification: Not required for paper cups but some buyers request
-SASO/ESMA Standards: Product safety certifications
Duty Savings Strategies:
-Free Trade Zones: Import to FTZ, pay duty only when releasing to market (defers cash flow)
-Bonded Warehouses: Store imported goods without paying duty until sold
-Tariff Engineering: Adjust product specs to qualify for lower HS code classification
Foodservice Recovery (Post-Pandemic):
-2024: Foodservice traffic at 102% of 2019 levels (full recovery + growth)
-2025-2030 CAGR: 4.2% growth in foodservice paper cup demand
-Driver: QSR expansion, coffee culture in emerging markets
Sustainability Mandates:
-Запрет на использование одноразового пластика: 72 countries with active bans by 2025 → paper cup substitution
-Corporate ESG: Major chains (McDonald’s, Starbucks) committing to 100% sustainable packaging by 2025-2030
-Consumer Preference: 68% willing to pay 5-10% more for sustainable options
E-Commerce and Delivery:
-Meal Delivery Growth: 12% CAGR (2024-2028) → increased takeaway cup usage
-Ghost Kitchens: 2,500+ operational in US alone → bulk cup purchasing
Capacity Expansion:
-Индия: $2.1 billion investment in paper packaging capacity (2024-2027)
-Юго-Восточная Азия: Vietnam, Indonesia ramping up production (labor cost advantage)
-Nearshoring: Mexico adding 3 major plants to serve US market (reduce shipping time/cost)
Material Innovation:
-Water-Based Coatings: 18% adoption in 2024 → projected 45% by 2028 (recyclability)
-PLA Coatings: 12% in 2024 → 22% by 2028 (compostability demand)
-Barrier Technology: Mineral coatings (non-plastic) emerging (currently 3% adoption)
Pricing Outlook (2025-2030):
## Strategic Sourcing Recommendations
Small Chains (50,000-200,000 cups/month):
-Стратегия: Purchase from domestic distributors for first 1-2 years (minimize complexity)
-Transition: Once volume exceeds 200,000/month, test direct import (1-2 containers)
-Supplier Count: Maintain 2 suppliers (primary + backup) to mitigate risk
Medium Chains (500,000-2,000,000 cups/month):
-Стратегия: Direct import from 1-2 Asian manufacturers (China/India), domestic backup
-Contract: Annual volume commitments for 5-10% price reductions
-Качество: Hire third-party inspection (SGS) for every shipment
Large Enterprises (5,000,000+ cups/month):
-Стратегия: Multi-source (Asia primary, domestic secondary, nearshore emerging)
-Manufacturing Partnerships: Co-invest in dedicated production lines for custom specs
-Логистика: Contract directly with shipping lines (avoid freight forwarder markups)
-Hedging: Financial instruments to lock raw material costs (pulp futures)
Leverage Points:
1.Volume Commitments: Guarantee 12-month forecast for 8-12% discount
2.Условия оплаты: Prepayment (50% deposit) unlocks 3-5% pricing concession
3.Гибкость: Accept longer lead times (90 days vs. 60) for 5-8% savings
4.Производство в непиковые часы: Order in Q1-Q2 (low season) for 10-15% discounts
Red Lines (Don’t Compromise):
-Quality Certifications: Always require FDA/EU compliance (non-negotiable)
-Inspection Rights: Reserve right to factory audit before large orders
-Force Majeure: Cap liability for supply chain disruptions but ensure backup supply
❌ Ошибка #1: Choosing supplier solely on lowest price without factory audit
✅ Правильный подход: Visit factory or hire third-party inspector for orders >$50,000. Verify equipment age, raw material sources, quality controls
❌ Ошибка #2: Ordering exactly what you need with zero buffer
✅ Правильный подход: Add 3-5% safety stock to order. Shipping delays, quality rejects, and demand spikes will occur—buffer prevents stock-outs
❌ Ошибка #3: Paying by wire transfer before production/inspection
✅ Правильный подход: Use Letter of Credit or escrow services for first 2-3 orders. Release 70% on inspection, 30% on delivery
❌ Ошибка #4: Ignoring tariff classification optimization
✅ Правильный подход: Work with customs broker to verify HS code. Small specification changes can shift from 5.5% to 0% tariff
The paper cups wholesale market comprises B2B transactions where buyers purchase 10,000+ units per order from manufacturers or distributors. It moved $18.2 billion globally in 2024 (420 billion units) across foodservice, institutional, and retail channels.
MOQs vary by customization: 10,000-50,000 for stock cups, 50,000-100,000 for 1-color print, 100,000-300,000 for full CMYK print, and 300,000-1,000,000 for custom sizes/shapes. Container load economics favor 500,000+ unit orders for import.
Standard 12oz PE-coated cups: $0.020-0.030 FOB China, $0.035-0.045 FOB Turkey, $0.06-0.09 ex-factory North America, $0.053-0.057 from US distributors (landed + markup). Compostable PLA-coated adds 20-35% premium.
Stock/generic: 7-15 days, custom print: 25-50 days, ocean freight adds 14-38 days (China→US), full cycle from PO to delivery: 45-90 days for imports, 15-30 days for domestic. Peak season (Q3-Q4) adds 2-4 weeks.
China produces 45% of global capacity (~190 billion cups/year), India 12%, Turkey 8%, North America 15%, EU 10%. China offers lowest FOB costs ($0.020-0.030) but longest shipping. Turkey provides EU proximity advantage.
FDA Контакт с пищевыми продуктами Notification (US market), EU Regulation 10/2011 compliance (Europe), FSC/PEFC (sustainable forestry), ISO 9001 (quality management). Third-party testing (SGS, Intertek) recommended for first orders and >200,000 unit shipments.
Direct manufacturer sourcing (save 35-50% vs. distributors), container-load orders (500,000+ units), annual volume commitments (8-12% discount), off-peak production (Q1-Q2, 10-15% discount), multi-sourcing competition, payment term optimization (prepayment unlocks 3-5%).
The paper cups wholesale market operates as a complex global ecosystem where raw material volatility, manufacturing capacity, shipping logistics, and regulatory compliance intersect to determine pricing and availability. Successful buyers navigate this landscape not through one-time transactional purchases but through strategic supplier relationships, supply chain diversification, and proactive quality management.
Основные выводы:
1.Geographic cost arbitrage is significant: FOB China ($0.020-0.030) vs. North America domestic ($0.06-0.09) creates 35-50% savings for importers willing to manage 60-90 day lead times
2.Container-load economics matter: 500,000+ unit orders optimize freight costs (40%+ per-unit savings vs. LCL/air freight)
3.Quality assurance is non-negotiable: Third-party inspection ($500-1,200) prevents $10,000-50,000 losses from defective shipments
4.Multi-sourcing mitigates risk: Primary Asian supplier + domestic backup balances cost and supply security
5.Sustainability drives future pricing: Water-based/PLA coatings command 20-35% premiums now but will become baseline as regulations tighten (2025-2030)
Whether you’re a distributor consolidating supply, a QSR chain optimizing procurement, or an importer building a paper products portfolio, understanding these supply chain dynamics enables you to negotiate better terms, manage risks proactively, and capitalize on market inefficiencies that separate profitable operations from margin erosion.
-Контейнеры для упаковки пищевых продуктов
-Export and Wholesale Services
Papacko manufactures and exports paper cups to 45+ countries with production capacity of 12 billion units annually. We offer MOQs from 50,000 units, FDA/EU certified materials, and full container-load direct shipping. Our supply chain includes 60-day production planning, SGS pre-shipment inspection, and export documentation handling.
Свяжитесь с нами:
Последнее обновление: Ноябрь 2025 г.