Готовы создать собственные фирменные бумажные стаканчики или упаковку?
Сообщите нам свои требования - размер, покрытие, печать и место назначения - и наша команда подготовит подробное коммерческое предложение в течение 24 часов.
Последнее обновление: Ноябрь 2025 г.
Время чтения: 8-10 минут
Автор: Papacko Content Team
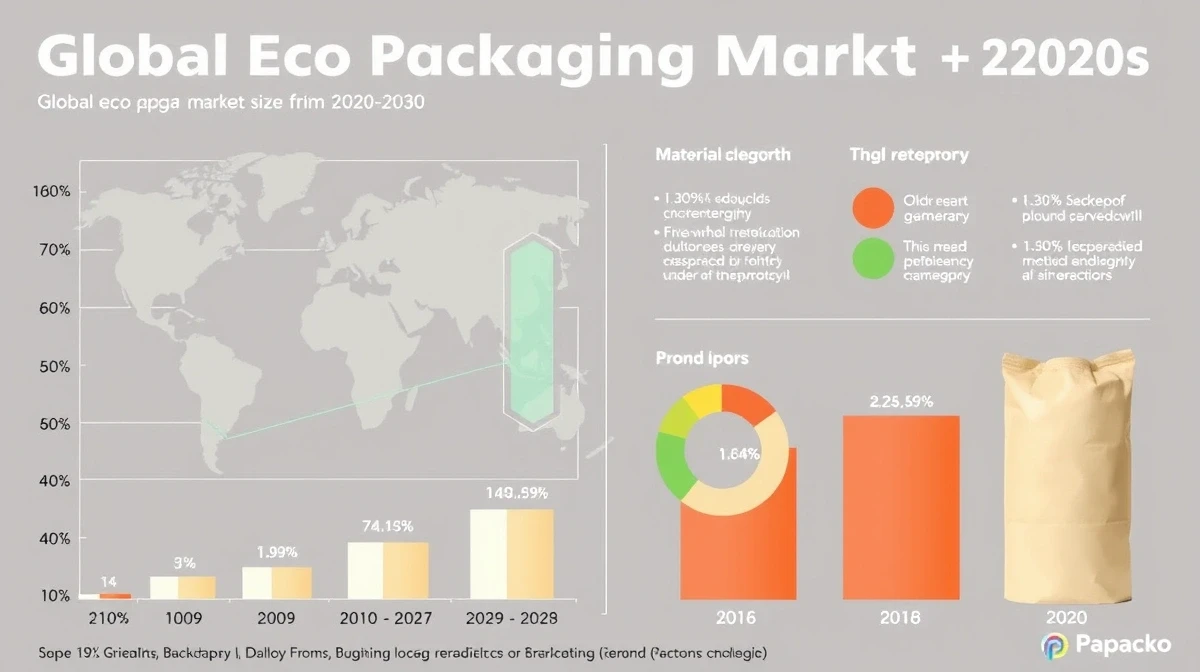
Рынок экоупаковки переживает беспрецедентный рост. Глобальный спрос на экологичные упаковочные решения достиг $267 миллиардов в 2024 году, а по прогнозам к 2030 году он достигнет $413 миллиардов - совокупный годовой темп роста (CAGR) 7,5%. Но за этими цифрами скрываются фундаментальные изменения в регулировании, поведении потребителей и инновациях в области материалов, которые меняют всю индустрию пищевой упаковки.
В этом руководстве, основанном на данных, анализируются силы, стимулирующие внедрение экоупаковки, анализируется динамика региональных рынков и приводятся практические рекомендации для предприятий, осуществляющих эти преобразования.
В этой статье вы узнаете:
-Размер рынка и прогнозы роста по регионам и категориям материалов
-Регулирующие факторы формирование требований к упаковке в странах ЕС, Северной Америки и Азии
-Тенденции потребительского поведения влияние на принятие решений о покупке
-Инновации в области материалов и новые технологии
💡 Быстрый вынос: Рынок экоупаковки не просто растет - он ускоряется.
Предприятия, инвестирующие в экологичную упаковку, получают конкурентные преимущества, соответствие нормативным требованиям и доступ к премиальным сегментам потребителей, готовых платить 10-15% больше за экологически чистую продукцию.
Рынок экоупаковки включает в себя все упаковочные материалы и решения, призванные минимизировать воздействие на окружающую среду за счет:
-Материалы, пригодные для вторичной переработки (бумага, картон, некоторые виды пластика)
-Компостируемые/биоразлагаемые варианты (PLA, формованное волокно, багасса)
-Многоразовые системы (схемы возврата депозитов, многоразовые контейнеры)
-Сокращение использования материалов (Облегчение, минималистичный дизайн)
Сегменты рынка:
Ключевые приложения:
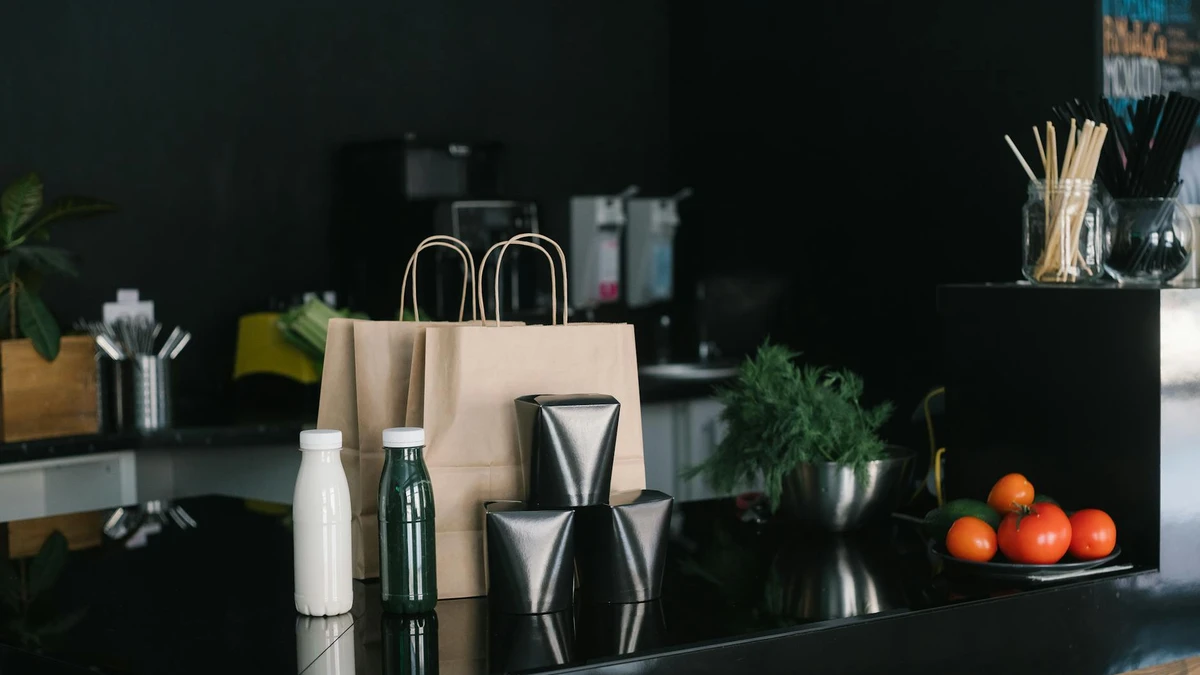
-Пищевая промышленность (чашки, миски, контейнеры для еды на вынос): 42% рынка экоупаковки
-Упаковка для розничной торговли продуктами питания (свежие продукты, пекарня): 28%
-Электронная коммерция Доставка: 15%
-Личный уход/косметика: 10%
-Другие: 5%
🎯 Отраслевой обзор: Пищевая промышленность доминирует в спросе на экоупаковку, поскольку в этом секторе наиболее высок уровень нормативного давления и внимания со стороны потребителей.
Рестораны быстрого обслуживания сталкиваются с непосредственным риском для бренда из-за неэкологичной упаковки.
Самые растущие рынки (2024-2030):
1.Индия: 11,2% CAGR (благодаря запрету на использование одноразового пластика в 2022 году)
2.Индонезия: 10,8% CAGR (обязательства АСЕАН по устойчивому развитию)
3.Германия: 9,5% CAGR (соблюдение закона об упаковке, депозитные системы)
4.Великобритания: 9.1% CAGR (налог на пластиковую упаковку)
5.Соединенные Штаты: 7,9% CAGR (расхождение на уровне штатов, лидирует Калифорния)
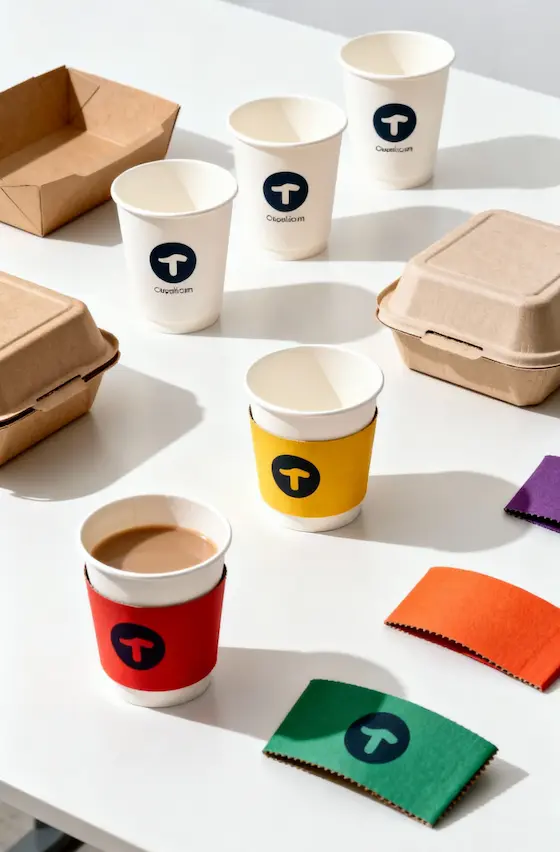
Рост производства бумажной упаковки:
-Размер рынка в 2024 году: $101 млрд.
-Прогноз на 2030 год: $148 млрд.
-CAGR: 6.8%
-Ключевые продукты: Бумажные стаканчики, Коробки для пищевых продуктов, пакеты для покупок, контейнеры из формованного волокна
Почему бумага лидирует: Развитая инфраструктура переработки, известность среди потребителей, конкурентоспособность по цене с обычными пластмассами во многих областях применения.
Рост биопластики:
-Размер рынка в 2024 году: $32 млрд.
-Прогноз на 2030 год: $64 млрд.
-CAGR: 12.3%
-Ключевые продукты: Чашки с покрытием PLA, компостируемые столовые приборы, пленки на биооснове
Вызов: Требуются промышленные установки для компостирования, которых пока нет на многих рынках. Загрязнение потоков вторсырья остается проблемой.
Директива ЕС по одноразовым пластмассам (2021):
-Запрещены пластиковые тарелки, столовые приборы, соломинки, мешалки, палочки для воздушных шаров
-Обязательный сбор 90% ПЭТ-бутылок к 2029 году
-Требуется расширенная ответственность производителя (EPR) для всей упаковки
Влияние на рынок экоупаковки:
Налог на пластиковую упаковку в Великобритании (2022):
-Налог в размере 200 фунтов стерлингов за тонну на пластиковую упаковку с содержанием вторичного сырья <30%
-Приводит к переходу на бумажные альтернативы или более высокое содержание переработанного пластика
-Результат: увеличение спроса на переработанный крафт на 24% контейнеры для пищевых продуктов
Соединенные Штаты Америки (вариации от штата к штату):
Канада:
-Федеральный запрет на использование одноразовых пластиков (поэтапное введение в 2022-2025 гг.)
-Затрагивает сумки для касс, столовые приборы, соломинки, палочки для размешивания, контейнеры для еды на вынос.
-Влияние на рынок: ежегодный рост компостируемой упаковки для общественного питания на 19%
Китай:
-2020: Запрет на неразлагающиеся пластиковые пакеты в крупных городах
-2022: Распространяется на все города и округа
-Цель на 2025 год: 40% сокращение потребления одноразового пластика
-Влияние на рынок: $12 миллиардов инвестиций в бумагу и упаковку на биооснове
Япония:
-Закон об обращении пластиковых ресурсов (2022)
-Обязательная плата за пластиковые пакеты и столовые приборы
-Цель: уровень переработки пластиковой упаковки 60% к 2030 году
-Результат: 17% рост бумажной упаковки для еды на вынос
Индия:
-Запрет на идентифицированные одноразовые пластиковые изделия в 2022 году
-Требования к толщине разрешенных пластиковых пакетов
-Реакция рынка: Рост спроса на банановый лист, багассу и альтернативные виды бумаги (+35% рост 2022-2024)
Вопрос: “Вы бы выбрали продукт с экологичной упаковкой вместо обычной, если бы цена была одинаковой?”
Готовность к премиям:
Ключевые моменты: “Сладкая точка” - это 5-10% премиум. За пределы 15% готовы платить только экологически сознательные ранние последователи.
Пищевая промышленность:
-78% потребителей ожидают, что кафе и рестораны будут использовать компостируемую или перерабатываемую упаковку
-62% будет активно избегать предприятий, использующих контейнеры из пенополистирола
-54% фотографировать и делиться эстетически привлекательной экологичной упаковкой в социальных сетях
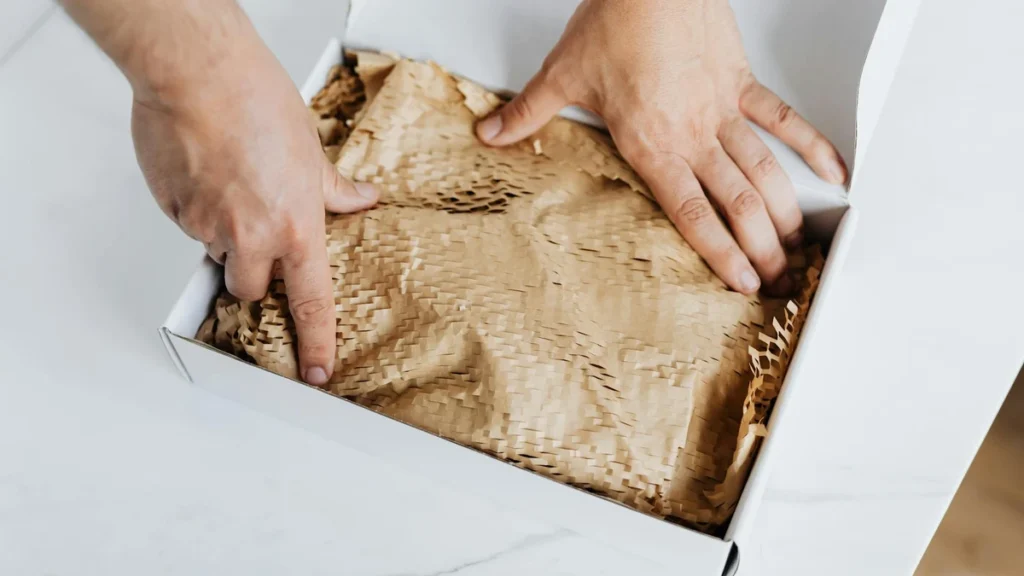
Электронная коммерция:
-71% предпочитает минимальную упаковку с использованием переработанных материалов
-49% предпочли бы одного ритейлера другому по признаку экологичности упаковки
-38% прекратили покупать товары данного бренда из-за чрезмерного количества отходов упаковки
Бумажные инновационные направления:
1.Барьерные покрытия: Покрытия на водной и минеральной основе, заменяющие PLA/PE, для улучшения перерабатываемости
2.Формованное волокно: 3D-формовка для сложных форм (чаши, раковины) с минимальным количеством материала
3.Наноцеллюлоза: Ультратонкие, прочные пленки с кислородными/влагозащитными свойствами
Крупнейшие корпоративные инвестиции (2023-2024):
-Нестле: $2,1 миллиарда на исследования и разработки в области экологичной упаковки к 2025 году
-Unilever: Переход на многоразовую, перерабатываемую или компостируемую упаковку 100% к 2025 году
-Макдоналдс: $1,4 млрд. инвестиций в инфраструктуру волоконной упаковки
-Starbucks: Отказ от пластиковых соломинок во всем мире (замена 1 миллиарда соломинок в год)
Слияния и поглощения:
-Компании, производящие бумажную упаковку, приобрели 37 стартапов в области производства биоматериалов (2023)
-Средняя премия за приобретение: 42% выше рыночной оценки
-Области внимания: Альтернативные варианты покрытия PLA, технология формованного волокна, поиск вторичного сырья
Наличие компостных сооружений:
Проблема: Чашки и контейнеры с PLA-покрытием требуют промышленного компостирования (55-60°C в течение 12+ недель). Без инфраструктуры они загрязняют потоки вторичной переработки или попадают на свалки, где не разлагаются.
Сравнение цен (за единицу, оптовые цены):
Анализ безубыточности:
-Операции с большими объемами (>50 000 единиц/месяц): Премия сужается до 20-40% с прямыми поставками от производителя
-Малые предприятия (<5 000 единиц/месяц): Превышение цены на 80-150% из-за ограничений MOQ и наценок дистрибьюторов
Распространенные заблуждения:
1.“Биоразлагаемый = экологически безопасный”: Неправда, если предметы оказываются на свалках без кислорода/микробов
2.“Вся бумажная упаковка подлежит вторичной переработке”.”: Бумага с фальшивым покрытием часто загрязняет потоки вторичной переработки
3.“Компостируемый - значит, пригодный для домашнего компостирования”.”: Для большинства из них требуются промышленные объекты при определенных температурах
Реакция промышленности: Более четкие стандарты маркировки, сертификационные знаки (BPI, TÜV Austria, логотип Seedling), кампании по просвещению потребителей.
Оцените свое положение на рынке:
### Окупаемость инвестиций превышает затраты
Ощутимые преимущества:
-Соответствие нормативным требованиям: Избегайте штрафов ($5,000-$50,000 за нарушение в некоторых юрисдикциях)
-Доступ на рынок: Требуется для заключения контрактов с крупными розничными сетями
-Управление отходами: Потенциальная экономия расходов на утилизацию в системах с оплатой по весу
Нематериальные преимущества:
-Капитал бренда: 37% миллениалов готовы сменить бренд ради экологичной упаковки
-Социальные сети: 54% более высокая вовлеченность в посты, содержащие экоупаковку
-Моральное состояние сотрудников: 68% работников предпочитают работодателей с обязательствами в области устойчивого развития
❌ Ошибка #1: Предполагая, что заявления об “экологичности” не требуют обоснования
✅ Правильный подход: Получение сертификатов третьей стороны (FSC, BPI, TÜV) и четкое указание ограничений (например, “промышленно компостируемый”).
❌ Ошибка #2: Переход на биопластики без проверки местной инфраструктуры компостирования
✅ Правильный подход: Проведите аудит возможностей вашего региона по утилизации отходов и выберите материалы, которые соответствуют имеющимся системам утилизации.
❌ Ошибка #3: Недооценка времени выполнения цепочки поставок для экоупаковки
✅ Правильный подход: Планируйте 8-12 недель на изготовление бумажной/биоупаковки по сравнению с 2-4 неделями на изготовление обычной пластиковой упаковки.
❌ Ошибка #4: Игнорирование общего воздействия на окружающую среду в течение всего жизненного цикла
✅ Правильный подход: Проведите LCA (оценку жизненного цикла), чтобы убедиться, что экоальтернатива действительно снижает чистое воздействие (некоторые требуют больше энергии/воды при производстве).
Рынок экоупаковки включает в себя все упаковочные материалы, предназначенные для минимизации воздействия на окружающую среду за счет возможности переработки, компостирования, повторного использования или сокращения расхода материалов. Его объем достиг $267 млрд в 2024 году и, по прогнозам, вырастет до $413 млрд к 2030 году.
Мировой рынок экоупаковки растет с совокупным годовым темпом роста (CAGR) 7,5% в период с 2024 по 2030 год. Сегмент биопластиков растет быстрее (12,3% CAGR), в то время как традиционные пластики снижаются (-2,1% CAGR).
К ключевым факторам относятся: (1) нормативные требования (Директива ЕС по одноразовым пластмассам, запреты на уровне штатов в США и Канаде), (2) потребительский спрос (68% предпочитают экологичную упаковку по сопоставимым ценам), и (3) корпоративные ESG-обязательства крупных брендов.
Да. Экоупаковка обычно стоит на 30-150% дороже обычных пластиковых аналогов, в зависимости от материала и объема. Покупатели с большими объемами (>50 000 единиц продукции в месяц) могут снизить эту стоимость до 20-40% благодаря прямым связям с производителями.
Европа лидирует с объемом рынка $98 млрд и темпами роста 8,2% в годовом исчислении, что обусловлено всеобъемлющими нормами ЕС. Азиатско-Тихоокеанский регион демонстрирует уверенный рост (7,9% CAGR) благодаря политике Китая в отношении пластиковых отходов и запрету на одноразовое использование в Индии.
Основные проблемы: (1) недостаточная инфраструктура компостирования для биопластиков, (2) ценовые надбавки, ограничивающие внедрение биопластиков малым бизнесом, (3) путаница потребителей в методах утилизации, и (4) недостатки в характеристиках влагостойкости и сроках хранения некоторых материалов.
Нет. По оценкам, к 2030 году экоупаковка будет занимать 70% упаковки для общественного питания и 55% упаковки для розничной торговли, однако традиционные пластики будут по-прежнему использоваться в областях, требующих особой прочности, барьерных свойств или оптимизации затрат.
Траектория роста рынка экоупаковки отражает фундаментальную реструктуризацию мировой упаковочной индустрии. Нормативно-правовое регулирование, потребительские предпочтения и корпоративные обязательства в области устойчивого развития привели к необратимому движению в сторону экологичных альтернатив.
Основные выводы:
1.Размер рынка увеличится 55% с 2024 ($267B) до 2030 ($413B), причем биопластики будут расти быстрее всего (CAGR 12,3%)
2.Нормативное давление стимулирует внедрение больше, чем готовы платить потребители, особенно в ЕС и прогрессивных штатах США
3.Бумажная упаковка доминирует текущие переходы благодаря развитой инфраструктуре переработки и конкурентоспособности затрат
4.Инфраструктурные пробелы ограничивают производство биопластиков: Только 18-32% населения имеют доступ к промышленному компостированию, необходимому для производства материалов PLA
5.Ценовые премии сокращаются: Крупные покупатели теперь платят на 20-40% больше по сравнению с 80-150% для мелких покупателей
Компании, которые активно переходят на экоупаковку, получают возможность соблюдать нормативные требования, повышают престиж бренда и получают доступ к растущим сегментам потребителей. Те, кто медлит, сталкиваются с ростом затрат, связанных с нормативными требованиями, ограничениями доступа на рынок и рисками для репутации бренда.
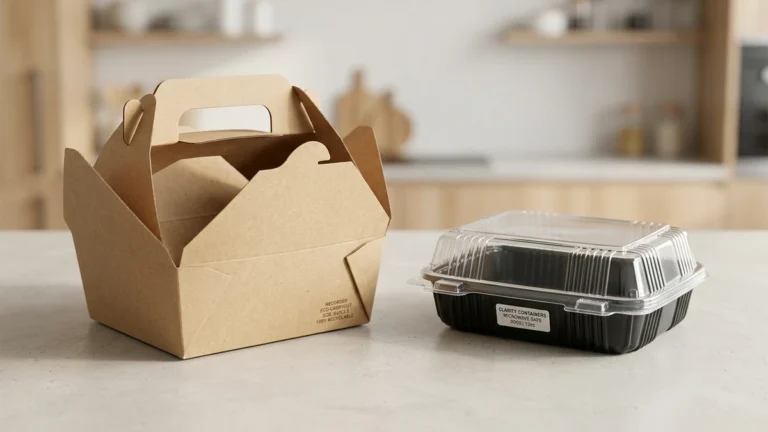
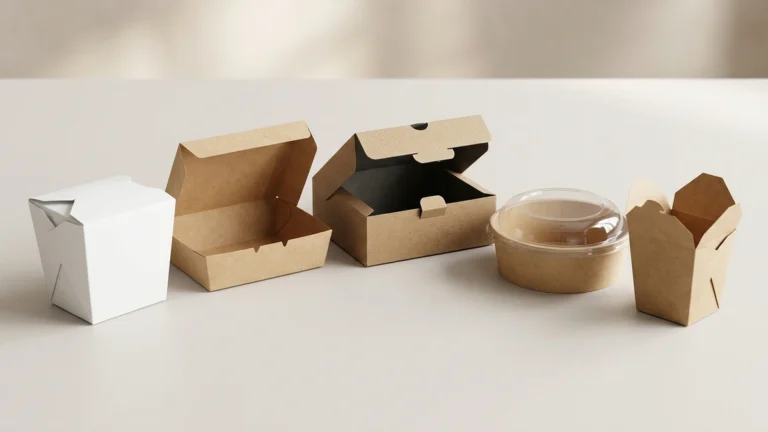
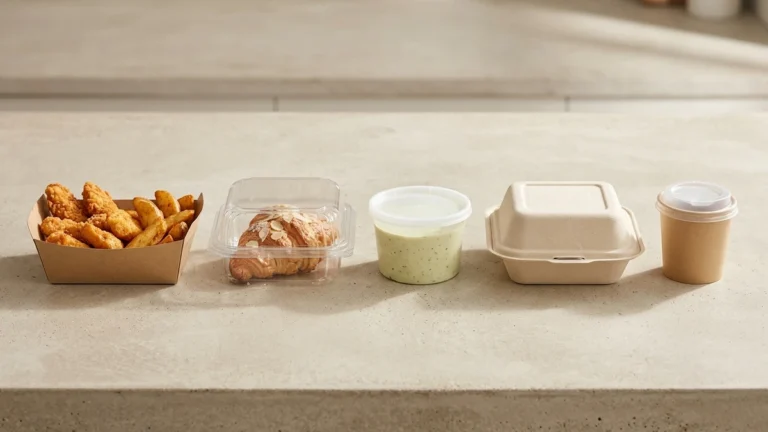
-Контейнеры для упаковки пищевых продуктов
Компания Papacko производит полный ассортимент экологичной упаковки для пищевых продуктов, включая бумажные стаканчики, контейнеры из формованного волокна и компостируемые аксессуары. Наша продукция соответствует нормативным стандартам ЕС и Северной Америки и сертифицирована для вторичной переработки или промышленного компостирования.
Market-growth pages are most useful when they connect numbers to operational choices: certification, legal pressure, and which sustainability routes are commercially actionable right now. These pages help bridge trend data with execution.
Свяжитесь с нами:
Последнее обновление: Ноябрь 2025 г.